


Is Forex Trading Legal in Malaysia? Find Out the Rules and Regulations in 2021
Is Forex Trading Legal in Malaysia? Forex trading, also known as foreign exchange trading, is a global decentralized market where currencies are …
Read Article
A moving average is a popular technical analysis tool used by traders and investors to forecast stock prices. It is a simple yet effective method that can help identify trends and provide insights into potential price movements in the future. In this step-by-step guide, we will explore the process of using moving averages to forecast stocks.
Step 1: Understanding Moving Averages
Moving averages are calculated by taking the average price of a stock over a specific period of time. This period can range from a few days to several months, depending on the desired level of analysis. By smoothing out price fluctuations, moving averages provide a clearer picture of the underlying trend.
For example, a 50-day moving average would be calculated by adding up the closing prices of a stock for the past 50 trading days and dividing the sum by 50. This results in a single data point, which represents the average price over that period.
Step 2: Determining the Type of Moving Average
There are different types of moving averages, such as simple moving averages (SMA) and exponential moving averages (EMA). SMA gives equal weight to all data points, while EMA gives more weight to recent data points. The choice between the two depends on personal preference and the specific requirements of the analysis.
Step 3: Analyzing Moving Averages
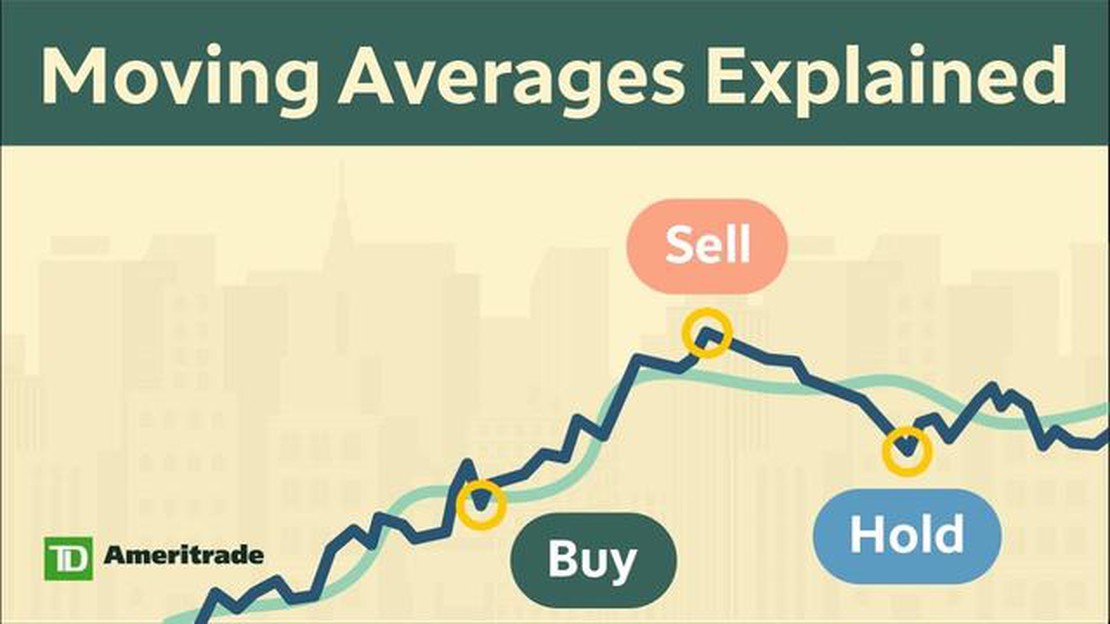
Once the moving average is calculated, it can be plotted on a stock chart to visualize the trend. Traders often use the crossover of two moving averages as a signal to buy or sell a stock. For example, if the shorter-term moving average crosses above the longer-term moving average, it is considered a bullish signal, indicating a potential uptrend.
However, it is important to note that moving averages are lagging indicators, meaning they are based on historical data and may not accurately predict future price movements. Therefore, it is crucial to use moving averages in conjunction with other technical analysis tools and fundamental analysis to make informed investment decisions.

Step 4: Refining the Moving Average Strategy
Read Also: What is a travel currency card? Learn all about it!
Traders can further refine their moving average strategy by experimenting with different time periods and combinations of moving averages. For example, using a shorter-term moving average for entry and a longer-term moving average for exit can help filter out false signals and improve the overall accuracy of the strategy.
In conclusion, moving averages are a valuable tool in forecasting stock prices. By analyzing the trends and crossovers of moving averages, traders and investors can gain valuable insights into potential price movements. However, it is important to remember that moving averages are not foolproof and should be used in conjunction with other analysis techniques to make informed investment decisions.
A moving average is a commonly used technical analysis tool used by traders and investors to identify trends in stock prices. It is a calculation that takes the average price of a stock over a specified period of time, with the goal of smoothing out short-term price fluctuations and highlighting longer-term trends.
There are different types of moving averages, including simple moving averages (SMA) and exponential moving averages (EMA). The simple moving average is calculated by summing up the prices over a specific time period and dividing it by the number of periods. The exponential moving average places more weight on recent prices, making it more responsive to recent price changes.
Moving averages are often used to determine support and resistance levels. When a stock price is moving above its moving average, it is seen as a bullish signal, indicating that the stock may continue to rise. Conversely, when a stock price is moving below its moving average, it is seen as a bearish signal, suggesting that the stock may continue to decline.
Traders and investors also use moving averages to generate buy and sell signals. For example, when a shorter-term moving average crosses above a longer-term moving average, it can be seen as a buy signal, indicating that it may be a good time to enter a long position. Conversely, when a shorter-term moving average crosses below a longer-term moving average, it can be seen as a sell signal, indicating that it may be a good time to exit a long position.
It’s important to note that moving averages are lagging indicators, meaning they are based on past prices and may not accurately predict future price movements. Therefore, they should be used in conjunction with other technical analysis tools and indicators to make informed trading decisions.
In conclusion, moving averages are a valuable tool for traders and investors to identify trends, determine support and resistance levels, and generate buy and sell signals. By understanding how moving averages work and incorporating them into your trading strategy, you can enhance your ability to forecast stock prices and make more informed trading decisions.
Read Also: Finding the Best Renko Indicator: A Comprehensive Guide
In order to calculate moving averages, you need to follow a few simple steps:

It’s important to note that the simple moving average is calculated using equal weight for each data point in the selected time period. This means that the most recent closing price is given the same weight as the oldest closing price in the time period.
To calculate more advanced moving averages, such as the exponential moving average (EMA), you will need to use a different formula that applies more weight to recent data points.
By calculating moving averages, you can smooth out the noise in stock price data and identify trends or patterns. This can help you make more informed decisions when it comes to forecasting stock prices or determining entry and exit points for trades.
Remember to consider the time period you use for your moving average calculations, as different lengths may provide different insights into the stock’s performance.
A moving average is a calculation used to analyze data points by creating a series of averages of different subsets of the full data set. It is commonly used in finance and stock market analysis to identify trends and forecast future prices.
A moving average helps in forecasting stock prices by smoothing out price data over a certain period. It helps to eliminate short-term fluctuations and highlight long-term trends. Traders and analysts use moving averages to identify potential buy or sell signals, as well as to determine support and resistance levels.
The two most commonly used moving averages are the simple moving average (SMA) and the exponential moving average (EMA). SMA calculates the average price over a specified period, while EMA gives more weight to recent prices. They both have their advantages and disadvantages, and the choice depends on the specific trading strategy and timeframe.
Yes, moving averages can be used for short-term trading. Traders often use shorter timeframes, such as 20-day or 50-day moving averages, to identify short-term trends and potential entry or exit points. However, it’s important to note that moving averages alone may not be sufficient for making trading decisions, and other indicators and analysis techniques should be used in conjunction.

Is Forex Trading Legal in Malaysia? Forex trading, also known as foreign exchange trading, is a global decentralized market where currencies are …
Read Article
What is a Binary App? In the world of technology, binary code plays a crucial role in enabling computers and other electronic devices to communicate …
Read Article
Can US citizens trade in Hong Kong? If you’re a US citizen interested in trading in the bustling and vibrant financial hub of Hong Kong, you might be …
Read Article
Forex Market Opening Hours Today The forex market, also known as the foreign exchange market, is a decentralized global market where the world’s …
Read Article
Can You Get Rich with Forex Trading? Forex trading, also known as foreign exchange trading, is a popular investment opportunity that allows …
Read Article
Is the forex market real or fake? The Forex market, also known as the Foreign Exchange market, is a decentralized global market where the world’s …
Read Article


