

Mastering Long-term Trades in Forex: Expert Tips and Strategies
Long-Term Forex Trading: Strategies and Tips Forex trading is a dynamic and fast-paced market where traders seek to profit from the fluctuations in …
Read Article
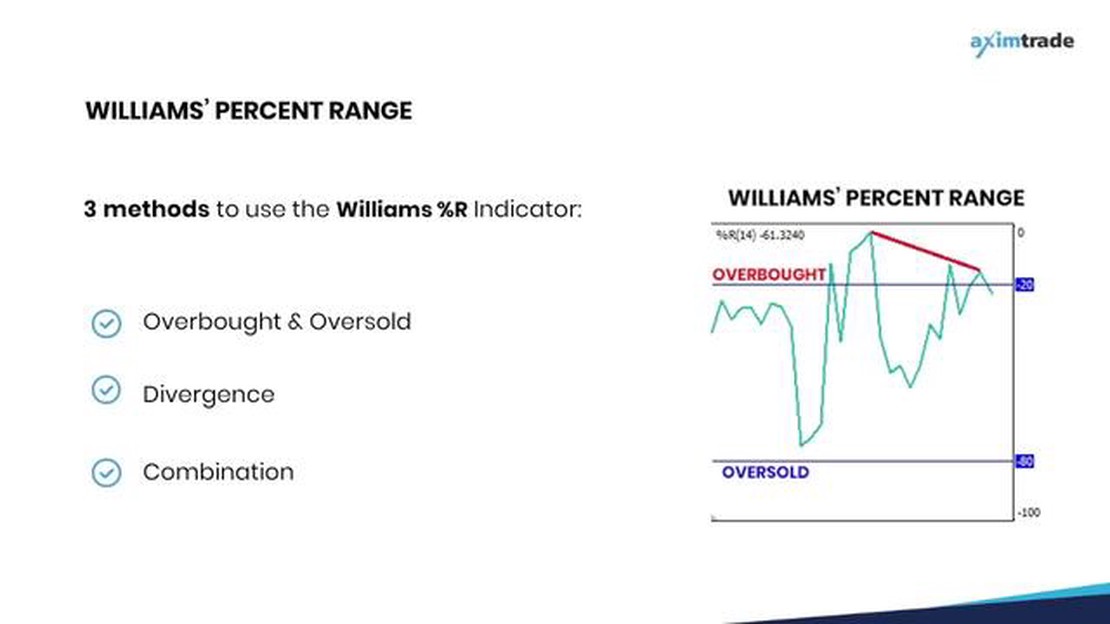
The Williams Percent Range (WPR) indicator, also known as Williams %R, is a popular technical analysis tool used by traders to identify overbought or oversold conditions in the market. Developed by legendary trader Larry Williams, WPR is a momentum oscillator that helps traders determine when an asset is likely to reverse its current trend.
WPR is based on the principle that market prices tend to close near their highs during uptrends and near their lows during downtrends. It measures the relationship between the current closing price and the high-low range over a specified period of time and then presents the result as a percentage. This percentage is plotted on a scale from 0 to -100, with values above -20 indicating overbought conditions and values below -80 indicating oversold conditions.
The WPR indicator can be used in various trading strategies to generate buy and sell signals. When the WPR line crosses below -80, it suggests that the market is oversold and a buying opportunity may be present. Conversely, when the WPR line crosses above -20, it suggests that the market is overbought and a potential selling opportunity may exist. Traders often combine the WPR indicator with other technical tools, such as moving averages or trend lines, to confirm their trading decisions.
It is important to note that the WPR indicator should not be used in isolation, as no single indicator provides foolproof signals. Traders should always consider multiple factors, including market trends, volume, and other technical indicators, before making trading decisions. Additionally, it is essential to practice proper risk management techniques and set stop-loss orders to protect against potential losses.
In conclusion, the WPR indicator is a valuable tool for traders looking to identify potential reversals in the market. By understanding how to interpret the WPR indicator and using it in conjunction with other technical analysis tools, traders can improve their chances of success and make more informed trading decisions.
The WPR Indicator, also known as the Williams Percent Range Indicator, is a popular technical analysis tool used by traders to identify overbought or oversold conditions in the market. It was developed by Larry Williams and is based on the idea that prices tend to close near the high or low of the trading range during strong trending periods.
The WPR Indicator is displayed as a line on a chart, ranging from 0 to -100. The indicator moves between these two extreme values, helping traders identify when a security is reaching extreme levels and is likely to reverse its trend. A value close to -100 indicates that the security is oversold, while a value close to 0 suggests that it is overbought.
Traders use the WPR Indicator in conjunction with other technical analysis tools to make informed trading decisions. It can be used as a standalone indicator or combined with other indicators, such as moving averages or trendlines, to confirm potential trading signals.

The WPR Indicator is especially useful in volatile markets, where prices tend to move within a wide range. It helps traders identify potential buying or selling opportunities when the price reaches extreme levels, indicating a potential reversal in the trend.
It’s important to note that like any technical indicator, the WPR Indicator is not foolproof and should be used in conjunction with other analysis techniques. It is best used as a tool to confirm other signals and provide additional insight into market conditions.
| Advantages | Disadvantages |
|---|---|
| Easy to understand and interpret | Can give false signals in ranging markets |
| Helps identify overbought and oversold conditions | May provide late signals in fast-moving markets |
| Can be used in conjunction with other indicators | Does not account for fundamental factors |
In conclusion, the WPR Indicator is a valuable tool for traders to identify overbought or oversold conditions in the market. It can help traders make more informed trading decisions and identify potential reversal points. However, it is important to use the indicator in conjunction with other analysis techniques to confirm signals and consider other factors that may affect market conditions.
Read Also: Discover how to effectively use futures in forex trading
The WPR (Williams Percent Range) is a popular technical analysis indicator that helps traders identify overbought and oversold conditions in the market. Developed by Larry Williams, the WPR indicator is based on the concept that prices tend to close near their high during a bullish trend and near their low during a bearish trend.
The main purpose of the WPR indicator is to measure the momentum of price movements and provide traders with potential buying or selling opportunities. It oscillates between 0 and -100, with values above -20 indicating overbought conditions and values below -80 indicating oversold conditions.
Read Also: Is a-Book or B Book Better? Comparing Book Types and Their Impact on Reading Experience
The WPR indicator is often used in conjunction with other technical indicators, such as moving averages or trend lines, to confirm trading signals and improve the accuracy of trading decisions. Traders look for divergences between the price and the WPR indicator, as well as for potential trend reversals indicated by extreme WPR values.
By understanding the purpose of the WPR indicator, traders can effectively utilize this tool to identify potential entry and exit points in the market. It helps traders avoid chasing overbought or oversold markets and instead wait for favorable conditions to enter or exit a trade.
It is important to note that the WPR indicator should not be used in isolation but as part of a comprehensive trading strategy. Traders should consider other factors, such as market trends, support and resistance levels, and fundamental analysis, to make informed trading decisions.
In summary, the WPR indicator serves as a valuable tool for traders to analyze market conditions and make informed trading decisions. By understanding its purpose and how it works, traders can use the WPR indicator to identify potential trading opportunities and improve their trading performance.

The WPR indicator, also known as Williams Percentage Range, is a technical analysis tool used to measure overbought or oversold conditions in the market.
The WPR indicator is calculated by taking the difference between the current closing price and the highest price over a given period, then dividing it by the difference between the highest price and the lowest price over the same period. The result is then multiplied by -100 to provide a percentage-based indicator.
The effectiveness of the WPR indicator can vary depending on the time frame being analyzed. It is commonly used on shorter time frames, such as hourly or daily charts, but can also be effective on longer time frames.
The WPR indicator can be used in trading to identify potential overbought or oversold conditions in the market. When the indicator reaches extreme levels, it may indicate that a reversal or correction is likely to occur. Traders can use this information to make buy or sell decisions.
Like any technical analysis tool, the WPR indicator has its limitations. It can generate false signals, especially in trending markets. Additionally, it should not be used as the sole basis for making trading decisions but should be used in conjunction with other indicators and analysis techniques.
The WPR indicator, or Williams %R, is a momentum oscillator that helps traders determine overbought and oversold levels in the market.
The WPR indicator works by measuring the close of an asset relative to the high and low of a specific time period. It oscillates between 0 and -100, with readings above -20 indicating overbought conditions and readings below -80 indicating oversold conditions.

Long-Term Forex Trading: Strategies and Tips Forex trading is a dynamic and fast-paced market where traders seek to profit from the fluctuations in …
Read Article
What is the average bonus for Morgan Stanley? As one of the leading financial institutions, Morgan Stanley is known for its competitive compensation …
Read Article
How to become a HFT trader? If you have a keen interest in financial markets and want to explore a career in trading, becoming a high-frequency …
Read Article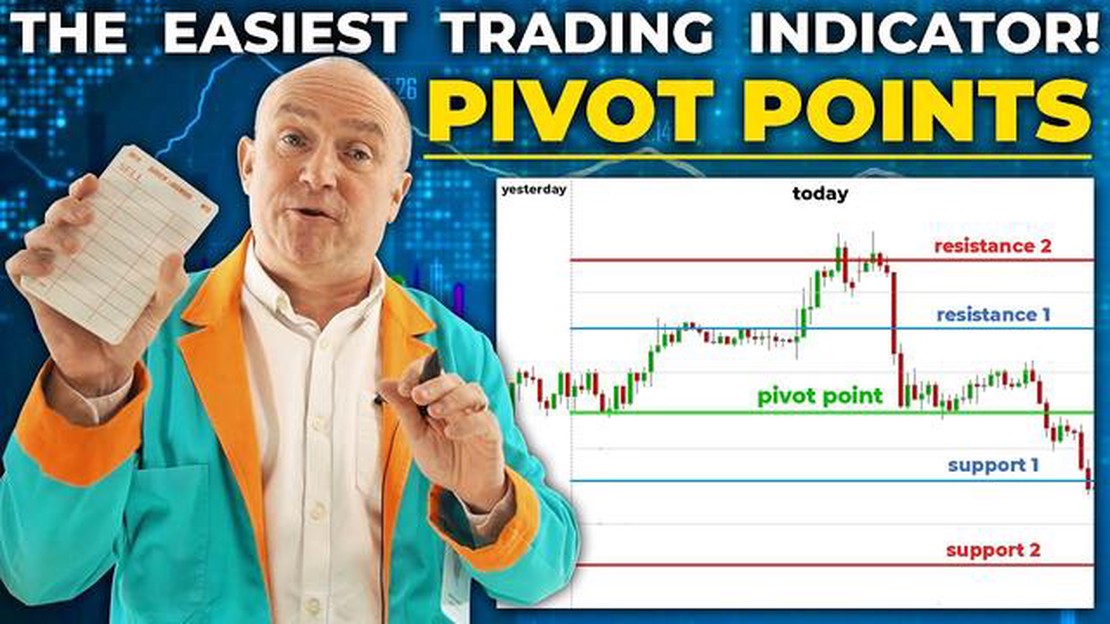
Should You Use Pivot Point as an Indicator in Trading? Pivot Point is a popular technical analysis tool used by traders and investors to identify …
Read Article
Backdating Stock Options: Understanding the Illegality Behind It Backdating stock options is a practice that involves retroactively changing the date …
Read Article
Forex Trading in African Countries: A Comprehensive Overview Forex trading has gained significant popularity in Africa over the past decade, with more …
Read Article


