


Understanding the 1:5 Risk Ratio: A Comprehensive Guide
Understanding the 1.5 Risk Ratio: An In-depth Explanation When it comes to assessing risks in various fields, the 1:5 risk ratio is a concept that is …
Read Article

The moving average is a widely used statistical indicator in technical analysis that helps traders and analysts identify trends and potential reversals in financial markets. It is a simple yet powerful tool that calculates the average price of a security over a specific period of time.
In this comprehensive guide, we will delve into the concept of the moving average and explore how it can be implemented in VBA (Visual Basic for Applications), a programming language integrated into Microsoft Office applications such as Excel.
To begin, we will discuss the different types of moving averages, including simple moving average (SMA) and exponential moving average (EMA), and explain their calculations and interpretations. We will also explore the role of the moving average in various trading strategies, such as trend following and mean reversion.
In addition, we will provide step-by-step instructions on how to write a moving average function in VBA, allowing you to calculate and visualize moving averages in Excel. We will cover topics such as data input, looping through cells, and graphing the results.
By the end of this guide, you will have a solid understanding of the moving average and how to implement it in VBA, empowering you to make informed trading decisions and enhance your analytical capabilities. Whether you are a beginner or an experienced trader, this guide will serve as a valuable resource in your journey to mastering the moving average in VBA.
The moving average is a commonly used statistical indicator that is used to analyze patterns and trends in time series data. It is calculated by taking the average of a set of data points within a specified period of time, or “moving window”. The moving average is used to smooth out fluctuations in the data and to identify underlying trends.
There are different types of moving averages, but the most commonly used ones are the simple moving average (SMA) and the exponential moving average (EMA). The simple moving average is calculated by summing up the data points within the moving window and dividing it by the number of data points. The exponential moving average, on the other hand, gives more weight to recent data points and is calculated using a smoothing factor.
The moving average can be used for various purposes, such as determining the direction of the trend, identifying support and resistance levels, and generating trading signals. It can be applied to different types of data, such as stock prices, economic indicators, and technical indicators.

To calculate the moving average, you need to choose a period of time or a moving window. The length of the moving window depends on the frequency of the data and the level of detail required. Generally, shorter moving windows react more quickly to changes in the data, while longer moving windows provide a smoother trend.
The moving average is a versatile tool that can be used in combination with other indicators and techniques to enhance analytical capabilities. It is important to note that the moving average is a lagging indicator, meaning that it is based on past data and may not predict future price movements accurately.
| Type | Calculation | Weighting |
|---|---|---|
| Simple Moving Average (SMA) | Sum of data points within the moving window divided by the number of data points | Equal weighting |
| Exponential Moving Average (EMA) | Smoothing factor*(Current data point - Previous EMA) + Previous EMA | Weighting on recent data points |
In VBA, you can calculate the moving average of a series of values by looping through the data and summing a specified number of values to calculate the average.
Read Also: Is Citi Velocity free? Find out everything you need to know about the cost of using Citi Velocity.
Here is an example of how to calculate the moving average of a series of values using VBA:
' Set the range of values to calculate the moving averageDim dataRange as RangeSet dataRange = ActiveSheet.Range("A1:A10")' Set the number of values to include in the moving averageDim period as Integerperiod = 3' Loop through the data range and calculate the moving averageDim i as IntegerDim total as DoubleFor i = period To dataRange.Rows.Counttotal = 0Dim j as IntegerFor j = i - period + 1 To itotal = total + dataRange.Cells(j).ValueNext jDim average as Doubleaverage = total / period' Do something with the calculated moving average, such as display it in a cellActiveSheet.Cells(i, 2).Value = averageNext i
In this example, we first set the range of values that we want to calculate the moving average for using the Range object. We also specify the number of values to include in the moving average using the period variable.
Next, we loop through the data range starting from the period value. Within each iteration of the loop, we reset the total variable to zero and then calculate the sum of the specified number of values using another nested loop. After calculating the total, we divide it by period to get the average and store it in the average variable.
You can customize this code to fit your specific needs, such as using a different range of values or a different period for the moving average. Additionally, you can modify the code to perform other calculations or actions based on the calculated moving average.
By utilizing VBA, you can easily calculate the moving average of a series of values and incorporate it into your Excel spreadsheets or other applications.
Using the moving average in financial analysis is a common practice that helps investors and analysts make sense of market trends and predict future price movements. The moving average is a statistical calculation that smooths out price data over a specific time period, providing a clearer picture of the overall trend.
Read Also: Why GARCH Outperforms ARIMA: A Comparative Analysis
One of the main reasons moving averages are used in financial analysis is to identify support and resistance levels. A support level is a price level at which a security tends to stop falling and start rising, while a resistance level is a price level at which a security tends to stop rising and start falling. By tracking moving averages, analysts can identify these levels and make well-informed decisions about when to buy or sell a security.
In addition to support and resistance levels, moving averages also help identify price reversals. A price reversal occurs when the direction of a security’s price movement changes, typically indicating a change in the overall trend. Moving averages can help investors spot these reversals and adjust their investment strategies accordingly.
Moreover, moving averages play a crucial role in risk management. By analyzing the relationship between short-term and long-term moving averages, analysts can assess the level of risk associated with a particular investment. For example, when the short-term moving average crosses below the long-term moving average, it may indicate a higher level of risk, prompting investors to consider selling their positions.
It’s important to note that there are different types of moving averages, such as the simple moving average (SMA) and the exponential moving average (EMA). Each type has its own strengths and weaknesses, and analysts often use a combination of moving averages to get a more accurate and comprehensive understanding of market trends.

In conclusion, using moving averages in financial analysis is an essential tool for investors and analysts. By analyzing moving average data, they can identify support and resistance levels, spot price reversals, and manage risk effectively. By incorporating moving averages into their decision-making process, investors can make informed investment choices and increase their chances of success in the market.
A moving average is a statistical calculation used to analyze data points by creating a series of averages of different subsets of the full data set. It is important in financial analysis because it helps in identifying trends and patterns in data, smoothing out fluctuations, and making predictions about future values.
The moving average is calculated by taking the average of a specified number of data points in a dataset and then moving the calculation forward by one data point at a time. This process is repeated until the desired number of moving averages is calculated.
There are several types of moving averages, including the simple moving average (SMA), the exponential moving average (EMA), the weighted moving average (WMA), and the triangular moving average (TMA). Each type has its own unique calculation method and characteristics.
The moving average can be used to identify trends by comparing the values of the moving averages at different points in time. When the moving average is increasing, it indicates an upward trend, while a decreasing moving average indicates a downward trend. Crossovers between different moving averages can also signal changes in trend.
Yes, the moving average can be used for short-term predictions by extrapolating the trend identified by the moving average. However, it is important to note that the moving average is a lagging indicator and may not always accurately predict future values, especially in volatile markets.

Understanding the 1.5 Risk Ratio: An In-depth Explanation When it comes to assessing risks in various fields, the 1:5 risk ratio is a concept that is …
Read Article
Do Indicators Work in Forex? In the fast-paced world of forex trading, traders are constantly searching for tools and strategies that can help them …
Read Article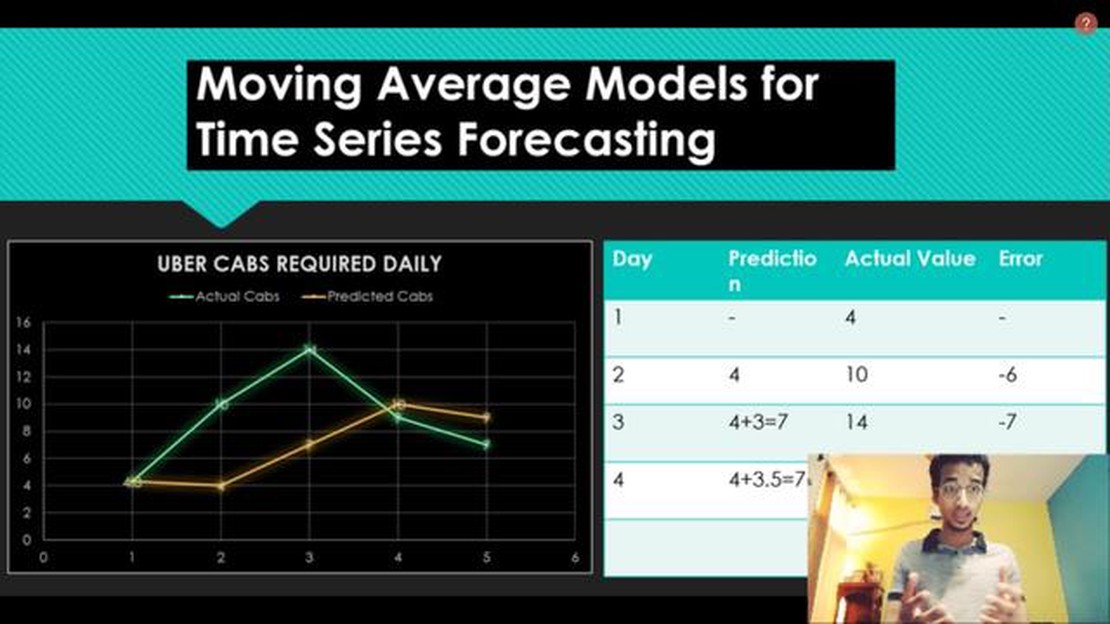
Understanding the Concept of Moving Average in Machine Learning When it comes to analyzing time series data, one of the most commonly used techniques …
Read Article
Cost of VPS for forex trading Forex trading has gained immense popularity in recent years, attracting traders from all walks of life. Whether you are …
Read Article
Is Binary Options Banned in Canada? Binary options trading has gained popularity in recent years as a way to make quick profits in the financial …
Read Article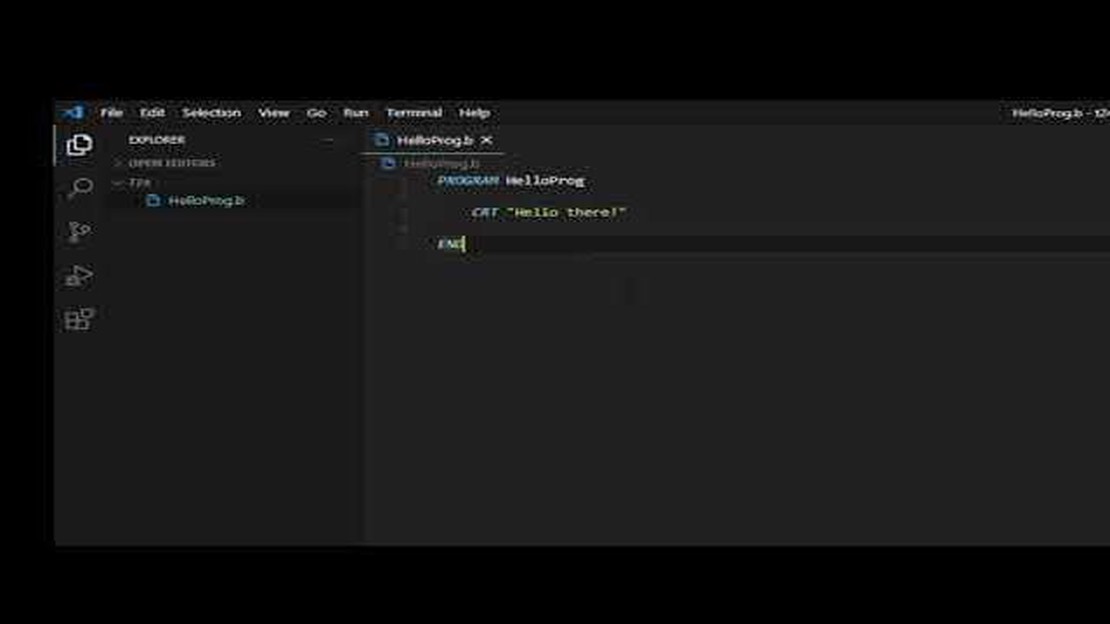
Pricing for T24 Are you curious about the cost of T24? Look no further! In this article, we will explore the pricing options for T24 and help you …
Read Article


