

Discover the Top Emini Day Trading Strategy for Maximum Profits
What is the Best Emini Day Trading Strategy? When it comes to day trading, having a solid strategy is essential for success in the fast-paced world of …
Read Article

In the world of technical analysis, the Exponential Moving Average (EMA) is a widely used tool for predicting future price movements and identifying trends. Unlike the Simple Moving Average (SMA), which gives equal weight to all data points, the EMA gives more weight to recent data points, making it more responsive to changes in price.
The span of the EMA refers to the number of data points included in the calculation. It is an important parameter that can significantly impact the accuracy of the EMA and the signals it generates. Understanding the span of the EMA is crucial for traders who rely on this indicator to make informed decisions in the market.
When choosing the span of the EMA, it is important to consider the timeframe and the nature of the asset being analyzed. Shorter spans, such as 9 or 12, are commonly used for day trading or for assets with high volatility, as they provide more timely signals. On the other hand, longer spans, such as 50 or 200, are often used for longer-term analysis or for assets with lower volatility, as they smooth out price fluctuations and provide a more reliable measure of the overall trend.
It is worth noting that there is no one-size-fits-all answer when it comes to choosing the span of the EMA. Traders should experiment with different spans and observe how they perform in different market conditions to find the one that works best for their trading strategy.
Overall, understanding the span of the EMA is essential for traders looking to utilize this powerful tool in their technical analysis. By selecting an appropriate span, traders can enhance the accuracy of the EMA and improve its effectiveness in predicting price movements and identifying trends.

The Exponential Moving Average (EMA) is a type of moving average that places more weight on recent data points, giving it a higher significance compared to simple moving averages. It is used to track the trend and provide insight into potential changes in the direction of a financial instrument’s price movement.
EMA calculations assign exponentially decreasing weights to each data point, with the most recent data points carrying the highest weight. This means that older data points have less impact on the overall average. The formula used to calculate the EMA involves weighting the previous EMA value and adding the latest data point multiplied by a smoothing factor.
The smoothing factor, often represented as a percentage, determines the speed at which the EMA adjusts to recent price changes. A smaller smoothing factor will result in a more reactive EMA, while a larger smoothing factor will make the EMA smoother and less affected by short-term price fluctuations.
Read Also: Is Being an Oil Trader a Lucrative and Rewarding Career Choice?
The EMA is commonly used in technical analysis to generate trading signals and identify potential entry or exit points. Traders and investors often rely on the EMA to confirm trends or determine the strength of a trend. It can also be used as a trailing stop-loss mechanism, where the stop-loss level is adjusted based on the EMA value.
Compared to simple moving averages, the EMA reacts faster to changes in price, making it more suitable for short-term analysis. However, it is important to note that the EMA is not a standalone indicator and should be used in conjunction with other technical analysis tools to make informed trading decisions.
In conclusion, the Exponential Moving Average (EMA) is a widely used tool in technical analysis that provides a smoother and more responsive average compared to simple moving averages. Understanding its basic concepts and how it differs from other moving averages can help traders and investors effectively incorporate it into their trading strategy.
Exponential Moving Average (EMA) is a widely used technical analysis tool that provides valuable insights into the trend of a security’s price over time. It is a weighted moving average that places more emphasis on recent price data, making it more responsive to recent price changes than other moving averages such as the simple moving average (SMA).
Read Also: Active vs Passive Trading Strategy: Which Approach is Right for You?
There are several reasons why EMA is important for technical analysis:
In conclusion, EMA is an important tool for technical analysis as it helps identify trends, support and resistance levels, generate entry and exit signals, measure market momentum, and assess volatility. Traders and investors can use EMA in combination with other technical indicators to make more informed trading decisions.
An Exponential Moving Average (EMA) is a type of moving average that gives more weight to recent data, making it more responsive to changes in price. It is calculated by applying a smoothing factor to the previous EMA value and the current price.

The smoothing factor in the calculation of EMA is determined by the length of the chosen time period. The shorter the time period, the more weight is given to recent data, resulting in a more sensitive EMA. The formula for calculating the smoothing factor is 2 ÷ (N + 1), where N is the length of the time period.
One advantage of using EMA over other types of moving averages is its responsiveness to changes in price. Since EMA gives more weight to recent data, it can provide faster signals when the price trend is changing. Additionally, EMA is less affected by older data, reducing the lag compared to other types of moving averages.
EMA can be used in technical analysis to identify trends, determine support and resistance levels, and generate trading signals. When the price is above the EMA, it indicates an uptrend, while a price below the EMA indicates a downtrend. Additionally, crossovers of different EMAs can be used to generate buy or sell signals.

What is the Best Emini Day Trading Strategy? When it comes to day trading, having a solid strategy is essential for success in the fast-paced world of …
Read Article
Understanding the M1 in Trading When it comes to trading and analyzing financial markets, it is important to have access to various charts and …
Read Article
Forex Market Opening Time on Sunday in the UK The forex market is a decentralized global market for the trading of currencies. It operates 24 hours a …
Read Article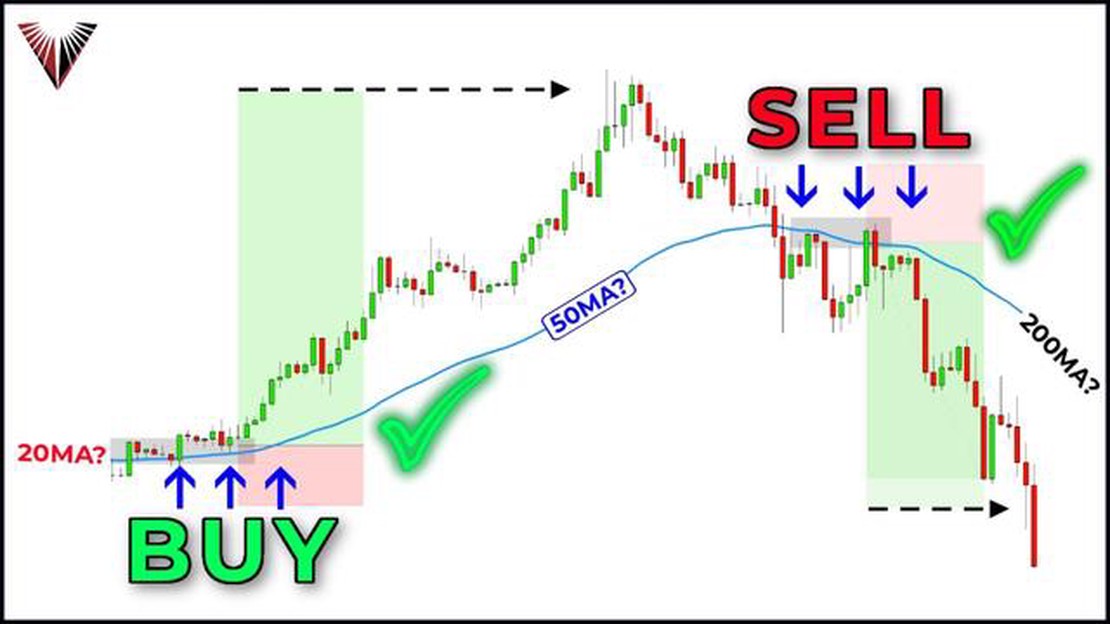
Moving Average for Trend Identification The moving average is a widely used technical analysis tool in the financial markets. It is a simple yet …
Read Article
Taxation of Exercised Stock Options: What You Need to Know Stock options are a common form of employee compensation, allowing individuals to purchase …
Read Article
How to send a complaint to a company If you have ever had a negative experience with a company, you know how frustrating it can be. Maybe you received …
Read Article


