

Understanding the VWAP Technique: A Comprehensive Guide
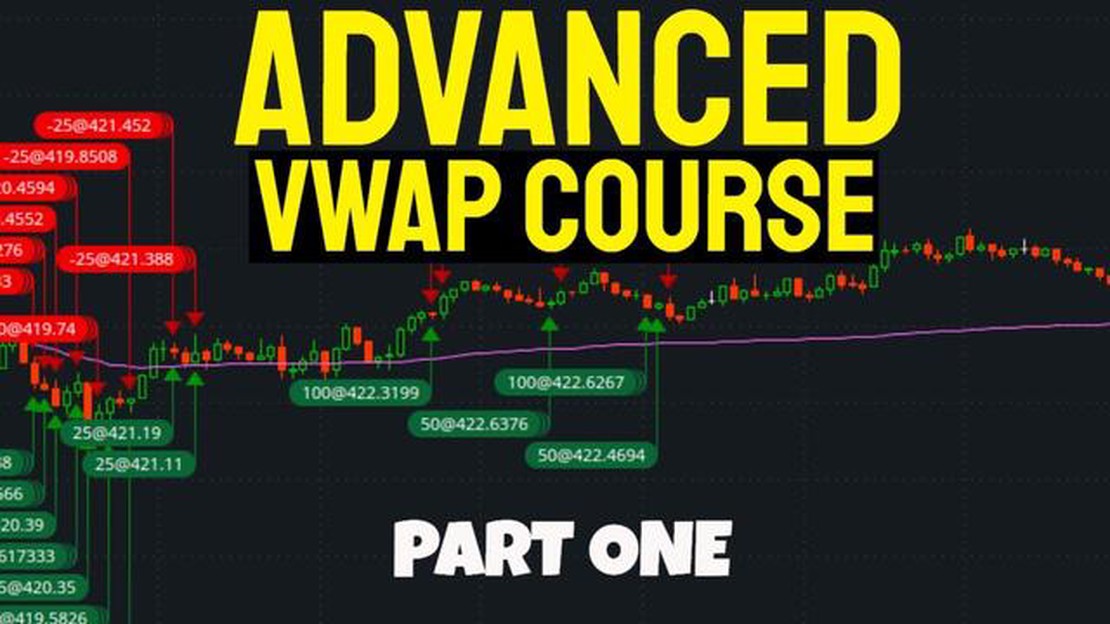
Understanding the VWAP Technique: A Comprehensive Guide The Volume-Weighted Average Price (VWAP) technique is a popular tool used by traders and …
Read Article
The moving average is a widely used technical analysis tool in the financial markets. It is a simple yet powerful indicator that helps traders identify trends and potential reversal points in price charts.
A moving average is calculated by taking the average price of a security over a specific period. This average is constantly updated as new data points become available. The most common type of moving average is the simple moving average (SMA), which gives equal weight to each price point in the calculation.
The moving average can be used to smooth out price fluctuations and filter out short-term noise, making it easier to spot and analyze trends. Traders often use moving averages of different lengths to identify short-term and long-term trends. For example, a shorter-term moving average (such as a 20-day SMA) may be used to identify short-term trends, while a longer-term moving average (such as a 200-day SMA) may be used to identify long-term trends.
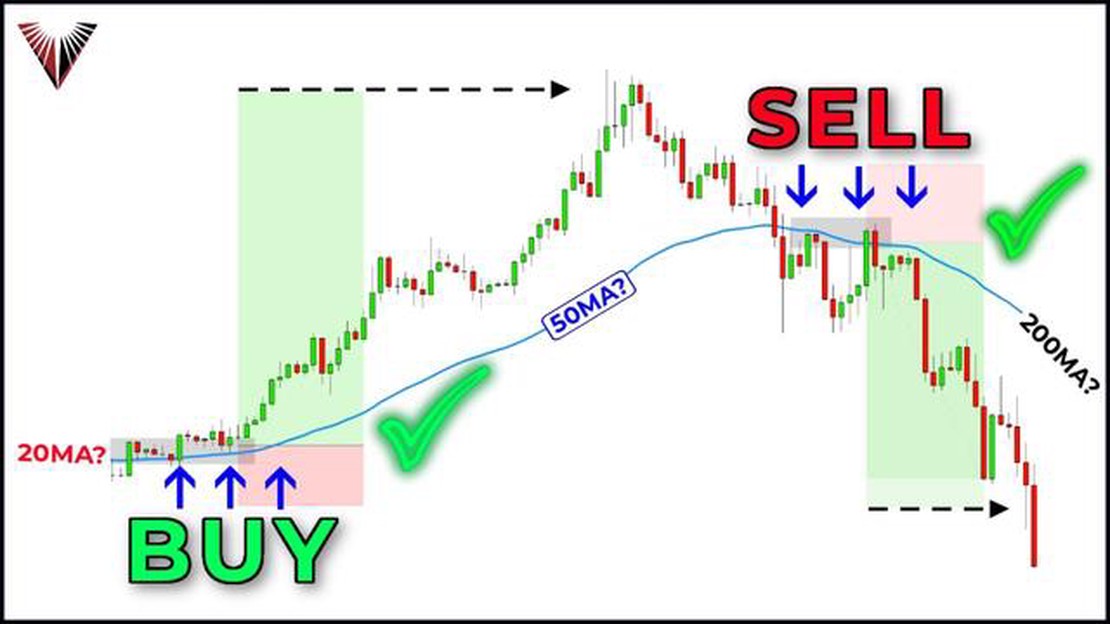
When the price of a security is above its moving average, it is generally considered to be in an uptrend. Conversely, when the price is below its moving average, it is generally considered to be in a downtrend. Traders may use these crossovers as signals to enter or exit positions. For example, a bullish crossover occurs when the shorter-term moving average rises above the longer-term moving average, signaling a potential buying opportunity.
However, it is important to note that moving averages are lagging indicators, meaning they are based on past price data. As a result, they may not always accurately predict future price movements. Traders should also consider other factors and use additional technical indicators to confirm signals provided by moving averages.
In conclusion, the moving average is a versatile tool that can help traders identify trends and make informed trading decisions. By utilizing different lengths of moving averages, traders can gain insights into short-term and long-term trends in the market. However, it is important to use moving averages in conjunction with other technical analysis tools to improve the accuracy of trend identification and maximize trading success.
A moving average is a popular technical analysis tool used by traders and investors to identify trends and smooth out price data. It calculates the average price of a security or asset over a specified period, which helps to filter out noise and highlight underlying trends.
The moving average is a lagging indicator, meaning that it is based on past price data and reacts to price changes after they occur. However, it can still be an effective tool for trend identification and can help traders make informed decisions.
There are different types of moving averages, including the simple moving average (SMA) and the exponential moving average (EMA). The SMA calculates the average closing price over a specific period, while the EMA gives more weight to recent price data.
The choice of the moving average period will depend on the trader’s time frame and trading style. Shorter periods, such as 10 or 20 days, are often used for short-term trading, while longer periods, such as 50 or 200 days, are more suitable for long-term analysis.
Traders often use moving averages in combination with other technical analysis tools, such as support and resistance levels, to confirm trends and identify potential entry and exit points. For example, if the price of a stock crosses above its 50-day moving average, it may be a bullish sign, indicating a potential upward trend.
It’s important to note that moving averages are not foolproof indicators and should be used in conjunction with other analysis tools and strategies. They can help traders identify trends and make better-informed decisions, but they cannot guarantee future price movements.

In conclusion, the moving average is a useful tool for trend identification and can help traders filter out noise and highlight underlying price trends. By calculating the average price over a specific period, it provides a smoothed representation of price data. However, it should be used in combination with other analysis tools and strategies to make more accurate trading decisions.
The moving average is a popular technical analysis tool used by traders to identify trends in financial markets. It is a simple yet powerful indicator that can help traders make informed decisions.
To calculate the moving average, you need a set of historical price data. The most common approach is to use the closing prices, but you can also use other price data like the high or low prices.
Read Also: Understanding the Moving Average in Kaggle: A Comprehensive Guide
Here is the formula to calculate the moving average:
Moving Average = Sum of the closing prices over a given period / Number of periods
For example, if you want to calculate the 10-day moving average, you would sum up the closing prices of the last 10 days and divide it by 10.
Once you have calculated the moving average, you can apply it to your chart to identify trends. If the current price is above the moving average, it suggests an uptrend, and if the price is below the moving average, it suggests a downtrend.
Traders often use multiple moving averages with different periods to get a clearer picture of the trend. For example, they might use a short-term moving average (e.g., 10-day) and a long-term moving average (e.g., 50-day). When the short-term moving average crosses above the long-term moving average, it signals a bullish trend, and when the short-term moving average crosses below the long-term moving average, it signals a bearish trend.
It is important to note that the moving average is a lagging indicator, which means it reacts to price movements after they occur. Therefore, it is advisable to use it in conjunction with other technical indicators or analysis methods to confirm trends.
Read Also: Maximizing Profit on a Covered Call: Strategies and Tips
In conclusion, the moving average is a versatile tool that can be used to identify trends and make trading decisions. By calculating and applying the moving average, traders can gain valuable insights into the direction of the market.
The moving average is a popular technical analysis tool used by traders and investors to identify trends in financial markets. It is a calculation that measures the average price of a security over a specified period of time and is represented as a line on a price chart.
By using a moving average, traders can smooth out short-term price fluctuations and focus on the overall direction of the market. This can be particularly helpful in identifying trends, as the moving average line will generally slope upward during an uptrend and downward during a downtrend.

There are different types of moving averages, including simple moving averages (SMA) and exponential moving averages (EMA). SMA calculates the average price over a specified number of periods, while EMA gives more weight to the most recent prices.
Traders can use moving averages in various ways to identify trends. One common approach is to look for the crossover of two moving averages. When a shorter-term moving average crosses above a longer-term moving average, it is considered a bullish signal, indicating a potential uptrend. On the other hand, when a shorter-term moving average crosses below a longer-term moving average, it is seen as a bearish signal, suggesting a potential downtrend.
| Date | Price |
|---|---|
| 01/01/2021 | 100 |
| 02/01/2021 | 105 |
| 03/01/2021 | 110 |
| 04/01/2021 | 115 |
For example, let’s consider a simple moving average crossover strategy using a 50-day SMA and a 200-day SMA. If the 50-day SMA crosses above the 200-day SMA, it can be a signal to go long or buy the security. Conversely, if the 50-day SMA crosses below the 200-day SMA, it can be a signal to go short or sell the security.
It’s important to note that moving averages are not foolproof indicators and may generate false signals during periods of consolidation or ranging markets. Traders should use moving averages in conjunction with other technical analysis tools and indicators to confirm trends and make informed trading decisions.
In conclusion, the moving average is a versatile tool for identifying trends in financial markets. By using moving averages, traders can filter out noise and focus on the overall direction of the market. Whether using simple or exponential moving averages, traders can utilize crossover strategies to identify potential buying or selling opportunities.
A moving average is a widely used statistical indicator that smooths out data over a specified time period, making it easier to identify trends and patterns in the data.
A moving average is calculated by adding up a certain number of data points, commonly known as the “window” or “period”, and then dividing the sum by the number of data points in the window. This calculation is then repeated for each subsequent data point, creating a moving average line.
The main purpose of using a moving average for trend identification is to filter out the noise or random fluctuations in the data and focus on the overall direction of the trend. It helps to smooth out the data and make the underlying trend more visible.
The two most commonly used types of moving averages are the simple moving average (SMA) and the exponential moving average (EMA). The SMA gives equal weight to all data points in the window, while the EMA gives more weight to the recent data points.
Moving averages can be used to determine support and resistance levels by observing how the price reacts to the moving average line. If the price consistently bounces off the moving average line, it can be considered a strong support or resistance level. Traders often use moving averages in combination with other technical indicators to confirm these levels.

Understanding the VWAP Technique: A Comprehensive Guide The Volume-Weighted Average Price (VWAP) technique is a popular tool used by traders and …
Read Article
Guide on Opening a Forex Broker in Malaysia If you’re considering opening a forex brokerage in Malaysia, you’re in the right place. Malaysia is a …
Read Article
What is the 4 week rule trend trading? Are you looking to gain a better understanding of trend trading? If so, the 4 Week Rule is a crucial concept to …
Read Article
Understanding the Gator Oscillator in Forex Trading In the fast-paced world of forex trading, it is crucial to have the right tools and indicators to …
Read Article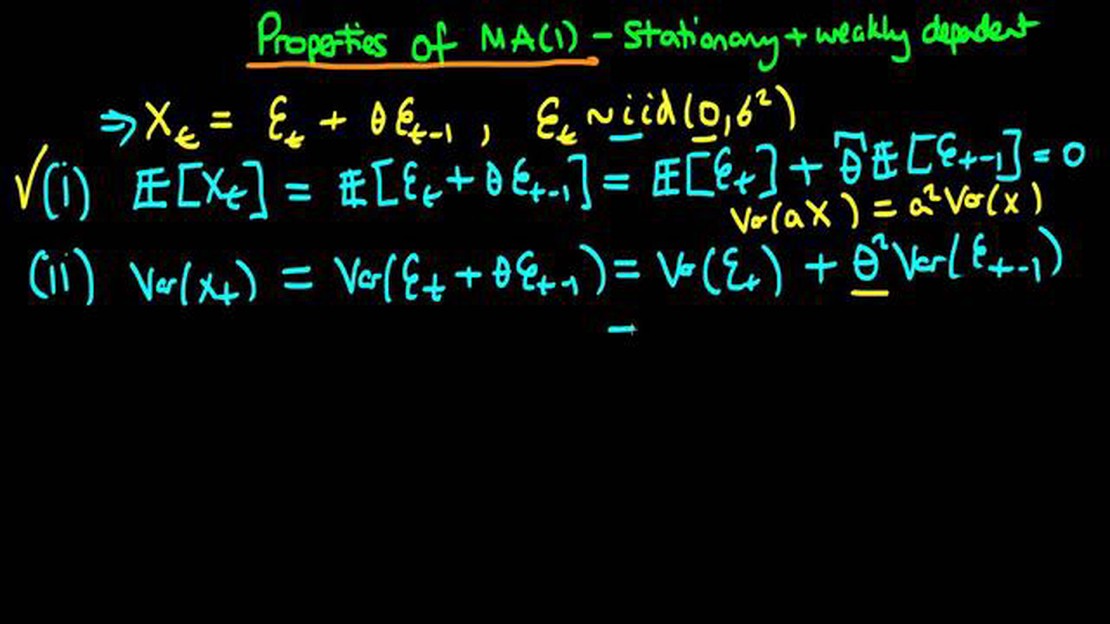
Is a moving average process always stationary? A moving average process is a common time series model that is used to analyze and predict trends in …
Read Article
Understanding the Importance of a Gain Report Gain reports are an essential tool for businesses and individuals who want to understand their financial …
Read Article


