


Is Forex Trading Legit? Uncovering the Truth Behind Forex Trading
Is Forex trading for real? Forex trading, also known as foreign exchange trading, has garnered a lot of attention in recent years. It is the largest …
Read Article
The Golden Cross and the 200-day moving average are two important technical analysis tools used by traders and investors to understand the trends and momentum of a stock or market. These indicators can provide valuable insights into the potential direction of prices and help guide investment decisions.
The Golden Cross occurs when the 50-day moving average crosses above the 200-day moving average. This bullish signal indicates that short-term price momentum is strengthening and that a significant uptrend may be underway. Traders often interpret the Golden Cross as a confirmation of a long-term bullish trend and consider it a buying signal.
On the other hand, the 200-day moving average is a widely followed indicator that shows the average price of a security over the past 200 trading days. This long-term moving average is often used to identify the overall trend of a stock or market. When the price of a security is above its 200-day moving average, it is generally considered to be in an uptrend.
The combination of the Golden Cross and the 200-day moving average can provide a strong confirmation of a bullish trend. When the Golden Cross occurs above the 200-day moving average, it suggests that the bullish trend is gaining momentum and that the stock or market is likely to continue its upward trajectory. Traders often use these indicators to identify entry and exit points for their trades.
While the Golden Cross and the 200-day moving average are powerful tools, it is important to remember that they are just one piece of the puzzle. Traders and investors should use them in conjunction with other technical and fundamental analysis tools to make well-informed decisions. Additionally, it is crucial to consider the specific characteristics of each stock or market and to adapt the analysis accordingly.
The Golden Cross is a commonly used technical analysis indicator in the stock market. It occurs when the short-term moving average, typically the 50-day moving average, crosses above the long-term moving average, usually the 200-day moving average.

This phenomenon is considered significant because it signals a potential change in the market trend. When the shorter-term moving average crosses above the longer-term moving average, it indicates that the stock’s price is increasing at a faster rate. This suggests that bullish momentum may be gaining strength and that it could be a good time to buy or hold onto the stock.
Traders and investors often use the Golden Cross as a confirmation tool for their trading decisions. It can help validate other technical indicators or patterns and provide additional confidence in the potential for a stock’s price to rise.
It is important to note that the Golden Cross is not a foolproof strategy and should not be solely relied upon for trading decisions. It is best used in conjunction with other technical indicators, such as volume analysis or trendlines, to gain a more comprehensive understanding of the market conditions.
Read Also: Which S&P 500 Index Fund Is Right for You?
Furthermore, the Golden Cross is a lagging indicator, meaning that it may not signal a trend reversal until after it has already occurred. As such, it is important to consider the overall market context and other factors before making any trading decisions based solely on the presence of a Golden Cross.
Despite its limitations, the Golden Cross remains a popular and widely followed indicator in the trading community. It serves as a useful tool for identifying potential entry and exit points in the market, providing traders with another piece of information to help guide their investment decisions.
The Golden Cross and the 200-Day Moving Average are technical indicators that are commonly used by traders and investors to understand the market trends and make informed decisions about buying or selling securities.
The Golden Cross occurs when the shorter-term moving average, such as the 50-day moving average, crosses above the longer-term moving average, such as the 200-day moving average. This is often seen as a bullish sign that the market is experiencing an upward trend and that it may be a good time to buy stocks or other securities.
The 200-Day Moving Average, on the other hand, is a long-term trend indicator that is calculated by summing up the closing prices of the security over the past 200 trading days and dividing it by 200. It smooths out the price fluctuations and provides a clear picture of the overall direction of the market. Traders and investors often use the 200-Day Moving Average as a benchmark to determine the overall trend of a security.
Both the Golden Cross and the 200-Day Moving Average are considered to be significant indicators because they are based on historical price data and provide insights into the overall market sentiment. However, it is important to note that these indicators are not foolproof and should not be used as the sole basis for making investment decisions.
Read Also: How Did David Choe Amass His Incredible Wealth?
Traders and investors should always conduct thorough research, consider other technical indicators and factors, and consult with financial professionals before making any investment decisions. By understanding the significance of the Golden Cross and the 200-Day Moving Average, traders and investors can add valuable tools to their arsenal and increase their chances of success in the market.
The Golden Cross is a technical pattern that occurs when a short-term moving average crosses above a long-term moving average. It is considered a bullish signal and is often used by traders to identify potential buying opportunities.
The Golden Cross is considered significant because it indicates a strong upward momentum in a stock or market. It suggests that the stock’s or market’s price is likely to continue rising in the future. Traders and investors often use the Golden Cross as a buy signal.

The Golden Cross and the 200-day moving average are related, but not exactly the same. The Golden Cross specifically refers to the crossing of two moving averages, while the 200-day moving average is a single moving average that represents the average price of a stock or market over the past 200 days. The Golden Cross can be seen as a confirmation of a bullish trend indicated by the 200-day moving average.
The 200-day moving average is considered important because it provides a long-term perspective on the price trend of a stock or market. It smooths out short-term fluctuations and helps identify the overall direction of the trend. Traders and investors often use the 200-day moving average as a reference point for determining the strength and direction of a stock or market.
Traders can use the Golden Cross and the 200-day moving average to identify potential buying or selling opportunities. When the Golden Cross occurs, indicating a bullish trend, traders may consider buying the stock or market. On the other hand, when the price crosses below the 200-day moving average, traders may consider selling or shorting the stock or market. These technical indicators can help traders make informed decisions based on the current price trend.
The golden cross is a bullish technical pattern that occurs when a short-term moving average crosses above a long-term moving average. The 200-day moving average is a widely watched indicator that represents the average closing price of a security over the past 200 trading days.
Some traders and investors use the golden cross and the 200-day moving average to determine when to buy or sell a security. When the golden cross occurs, it is seen as a bullish signal and may indicate that a security’s price is likely to increase. Conversely, if the price falls below the 200-day moving average, it may be a bearish signal indicating that the price could continue to decline.

Is Forex trading for real? Forex trading, also known as foreign exchange trading, has garnered a lot of attention in recent years. It is the largest …
Read Article
What is the most affordable method to purchase currency? In today’s globalized world, buying currency has become a necessity for many individuals and …
Read Article
Cost of Autopilot Trading App: A Complete Breakdown The emergence of autopilot trading apps has revolutionized the way people invest in financial …
Read Article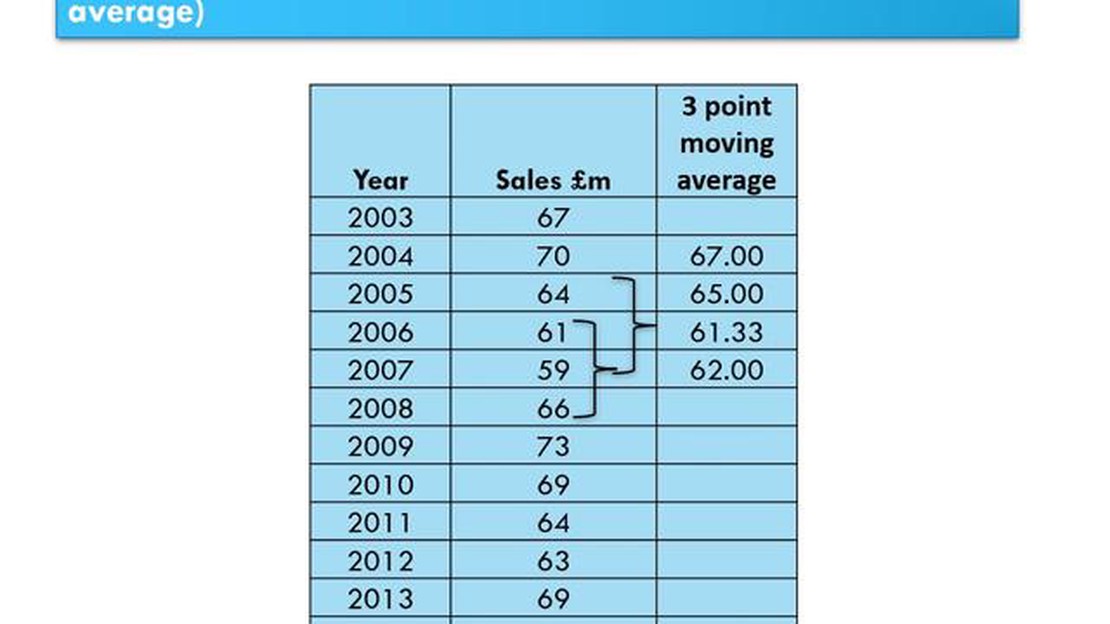
Calculating the 3-Point Moving Average: A Step-by-Step Guide The 3-point moving average is a simple but effective statistical technique used to …
Read Article
Today’s JN Bank Exchange Rate When it comes to banking, exchange rates play a crucial role. Whether you’re traveling abroad, sending money to family …
Read Article
Axis Bank Forex Card Contact Information If you are a customer of Axis Bank’s forex card services and have any queries or require assistance, it is …
Read Article


