

Can I Trade Options with Margin? Explained
Trading Options with Margin: Everything You Need to Know Trading options with margin can be a lucrative strategy for experienced traders, but it is …
Read Article
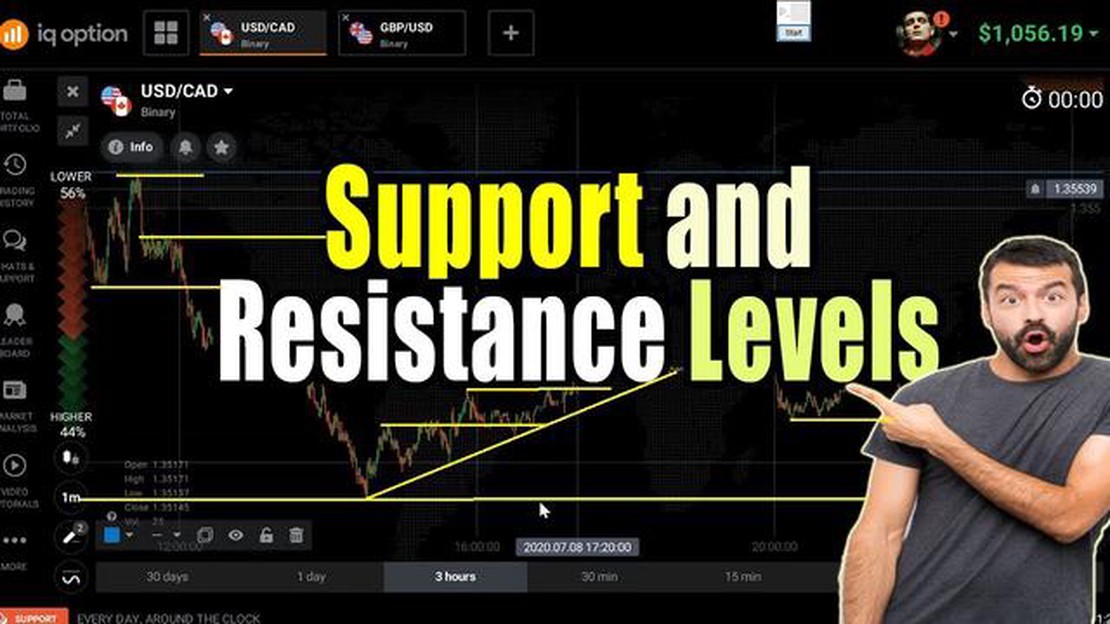
Support and resistance levels are essential tools in technical analysis, helping traders identify potential entry and exit points in the market. Understanding how to draw support and resistance levels correctly can greatly improve one’s trading strategy. In this step-by-step guide, we will explore the process of drawing support and resistance levels on the IQ Option platform.
Firstly, it is important to understand the concept of support and resistance. Support level is a price level at which buyers are expected to enter the market, causing the price to bounce back up. Resistance level, on the other hand, is a price level at which sellers are expected to enter the market, pushing the price back down. These levels are formed based on historical price data and act as psychological barriers for future price movements.
To draw support and resistance levels on the IQ Option platform, start by identifying significant price points. These can be previous highs or lows, areas where the price has reversed direction, or levels where the price has consolidated for an extended period. Once you have identified these points, use the drawing tools provided by IQ Option to draw trendlines connecting them. Make sure to include at least three touches on the trendline for it to be considered valid.
It is important to note that support and resistance levels are not fixed, but rather dynamic. As the market evolves, these levels may shift or break altogether. Traders should regularly review and adjust their support and resistance levels to align with the current market conditions. By mastering the skill of drawing support and resistance levels accurately, traders can gain an edge in identifying potential market reversals and breakouts.
In technical analysis, support and resistance levels are crucial concepts that help traders identify potential reversals or continuations in price movements. Support levels can be thought of as the floor below which the price of an asset is unlikely to fall, while resistance levels can be seen as a ceiling above which the price is unlikely to rise.

Support levels are formed when the demand for an asset is strong enough to prevent its price from decreasing further. These levels can be identified by looking for areas where prices have previously reversed direction and started to rise. When the price reaches a support level, traders may expect it to bounce off and continue its upward movement.
Resistance levels, on the other hand, are formed when the supply of an asset is strong enough to prevent its price from increasing further. These levels can be identified by looking for areas where prices have previously reversed direction and started to drop. When the price reaches a resistance level, traders may anticipate it to retreat and continue its downward movement.
Read Also: Is Forex Legal in Malaysia? Understanding the Laws and Regulations
Support and resistance levels are not exact points, but rather zones where buying or selling pressure tends to be concentrated. They are often represented as horizontal lines on a price chart. Multiple touches or “bounces” off a support or resistance level increase its significance and make it stronger.
Support levels can also “flip” and become resistance levels once they are broken. Similarly, resistance levels can transform into support levels if they are breached. These role reversals can provide traders with valuable insights into potential future price action.
Understanding support and resistance levels is essential in technical analysis as they can help traders make informed decisions about when to enter or exit trades. By incorporating these levels into their trading strategy, traders can increase their chances of success and better manage their risk.
The first step in drawing support and resistance levels in IQ Option is to identify the swing highs and lows on the price chart. Swing highs are the highest points reached by the price, while swing lows are the lowest points reached by the price.
To identify swing highs and lows, you need to look for areas where the price has made a significant reversal. These reversal points can be found by observing the peaks and troughs on the price chart.
Once you have identified the swing highs and lows, you can draw horizontal lines at these levels to represent the support and resistance levels.
Support levels are drawn at the swing lows and represent areas where the price has a tendency to bounce back up. Resistance levels are drawn at the swing highs and represent areas where the price has a tendency to bounce back down.
By drawing support and resistance levels, you can identify important price levels where the market is likely to react. These levels can be used to enter or exit trades, set stop-loss orders, or take profit.
Read Also: What Happens if Limit Order is Not Executed? Understanding the Consequences of Unfilled Limit Orders
| Step 1: Identify the Swing Highs and Lows |
|---|
| 1. Look for areas where the price has made a significant reversal. |
| 2. Identify the swing highs and lows. |
| 3. Draw horizontal lines at these levels to represent support and resistance. |
| 4. Support levels are drawn at the swing lows, while resistance levels are drawn at the swing highs. |
| 5. These levels can be used for trading decisions and risk management. |
Support and resistance levels are price levels on a chart where the price of an asset tends to stop falling and starts rising (support level) or stop rising and starts falling (resistance level). These levels can help traders identify potential entry and exit points for their trades.

To draw support and resistance levels on IQ Option, you can use the horizontal line tool. Simply select the tool, click on the desired price level on the chart, and drag the line to the right. Repeat this process for other significant price levels on the chart.
No, support and resistance levels can vary across different timeframes. Higher timeframes tend to have stronger and more significant support and resistance levels, while lower timeframes may have more short-term and weaker levels.
Yes, support levels can become resistance levels and vice versa. When the price breaks below a support level, it can later act as a resistance level if the price attempts to move back up. Similarly, when the price breaks above a resistance level, it can later act as a support level if the price attempts to move back down.
You can use support and resistance levels in your trading strategy by looking for price action signals and patterns near these levels. For example, if the price is approaching a strong resistance level and you see a bearish candlestick pattern forming, it could be a potential signal to enter a short trade. Conversely, if the price is approaching a strong support level and you see a bullish candlestick pattern forming, it could be a potential signal to enter a long trade.

Trading Options with Margin: Everything You Need to Know Trading options with margin can be a lucrative strategy for experienced traders, but it is …
Read Article
Understanding the Vesting Schedule for Startup Founders When it comes to startup founders and equity, understanding the vesting schedule is crucial. …
Read Article
Deposit Cash Money: Step-by-Step Guide Depositing cash money is a convenient and secure way to manage your finances. Whether you need to deposit money …
Read Article
2023 Day Trading Rules: Everything You Need to Know Day trading has become increasingly popular in recent years, thanks to advancements in technology …
Read Article
Understanding the Implications of a High Moving Average When it comes to trading in the financial markets, understanding the significance of various …
Read Article
Understanding Price Action in Forex Trading Price action is a fundamental concept in forex trading that refers to the analysis of historical price …
Read Article


