


Is Old Philippine Money Still Valid? The Truth Revealed
Is the old Philippine money still valid? Many people often wonder if their old Philippine money is still valid. With the introduction of new currency …
Read Article
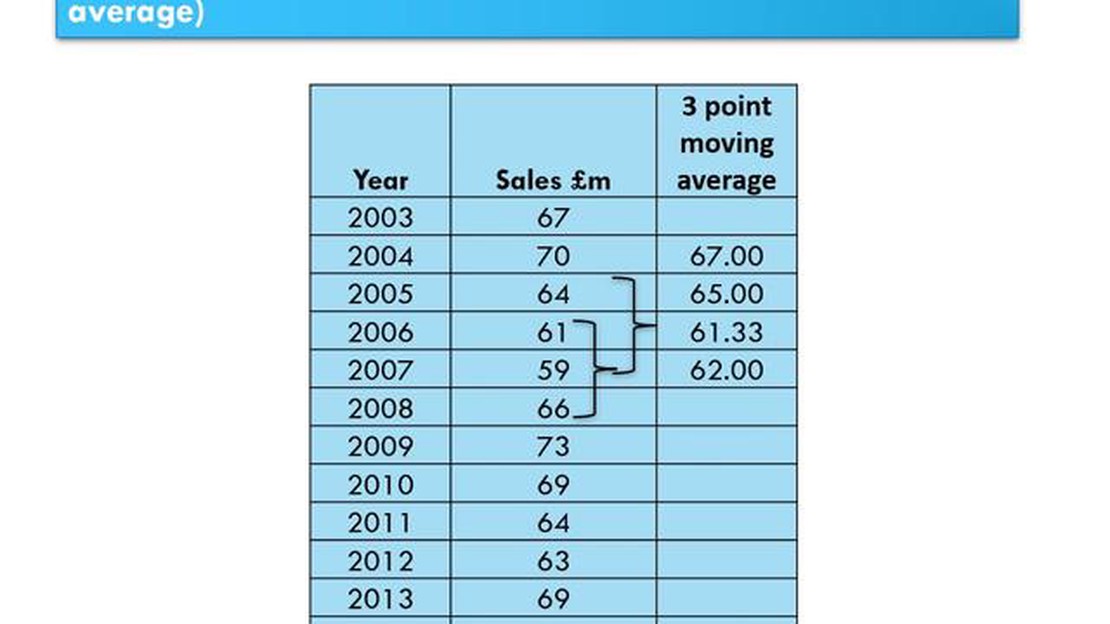
The 3-point moving average is a simple but effective statistical technique used to analyze and understand data trends. It provides a smoothed representation of a dataset by calculating the average of three consecutive data points at a time. This moving average helps to filter out short-term fluctuations and highlight long-term patterns or trends in the data.
To calculate the 3-point moving average, you need to follow a simple step-by-step process. First, identify the dataset you want to analyze. This dataset can represent various types of information, such as stock prices, sales figures, or weather data. The key is to have a sequence of data points that you want to smooth out.
Once you have the dataset, you can begin calculating the 3-point moving average. Start by summing up the values of the first three data points in the sequence. Then, divide the sum by 3 to calculate the average. This average represents the smoothed value for the first three data points.
Next, move one data point forward in the sequence and repeat the process. Sum up the values of the next three data points and divide the sum by 3 to calculate the average. Continue this process until you have calculated the moving average for all the data points in the sequence. Each moving average value represents the smoothed value for the corresponding three data points.
It is important to note that as you calculate the moving average, the number of data points included in the calculation decreases towards the end of the sequence. This means that the moving average can become less reliable towards the final data points.
The 3-point moving average can be a valuable tool for identifying trends and making predictions based on the historical data. By smoothing out short-term fluctuations, it provides a clearer picture of the underlying pattern or trend in the data. Whether you are analyzing financial data, tracking sales performance, or studying weather patterns, the 3-point moving average can help you gain insights and make informed decisions.
A moving average is a statistical calculation used to analyze data points over a certain period of time. It is commonly used in financial analysis, trend forecasting, and technical analysis in stock market trading. The moving average smooths out fluctuations and highlights trends in the data, making it easier to identify patterns and make informed decisions.
The concept of a moving average is based on the idea that by taking an average of a set of data points over a specific time period, you can get a better understanding of the overall trend. It is particularly useful in situations where data fluctuates greatly or has a lot of noise, as it helps to filter out the noise and reveal the underlying pattern.
There are different types of moving averages, such as the simple moving average (SMA), the exponential moving average (EMA), and the weighted moving average (WMA). The choice of which type to use depends on the specific application and the desired level of sensitivity to recent data points.
To calculate a moving average, you take the sum of the data points over a specific time period and divide it by the number of points in that period. As new data points become available, the oldest data point is dropped and the newest one is added to the calculation. This creates a moving window of data points that continuously updates and reflects the most recent trends.
Overall, a moving average is a powerful tool for analyzing data and making predictions based on historical trends. It helps to identify support and resistance levels, as well as turning points in a time series. By understanding how to calculate and interpret moving averages, you can gain insights into the behavior of a data set and make more informed decisions.

Calculating the 3-point moving average involves a simple mathematical formula. It requires adding up the closing prices of the past three days and dividing the sum by three.
To calculate the 3-point moving average, follow these steps:
| Day | Closing Price | 3-Point Moving Average |
|---|---|---|
| 1 | 10 | N/A |
| 2 | 15 | N/A |
| 3 | 12 | N/A |
| 4 | 18 | 12.33 |
| 5 | 20 | 16.67 |
| 6 | 25 | 21 |
Read Also: What Happens When You Exercise a Stock Option? | Learn About the Process and Implications
For example, let’s calculate the 3-point moving average for day 4. The closing prices for the past three days are 10, 15, and 12. Add them up: 10 + 15 + 12 = 37. Then, divide the sum by 3: 37 / 3 = 12.33. So, the 3-point moving average for day 4 is 12.33.
Repeat this calculation for each day to find the 3-point moving average for the entire period of interest.
To calculate the 3-point moving average, first, you need to collect the data that you want to analyze. This data can be any type of numerical data, such as stock prices, sales figures, or temperature readings.
Make sure that you have a sufficient amount of data points to get accurate and meaningful results. The more data points you have, the better your analysis will be.
Record the data points in a spreadsheet or any other format that allows you to easily organize and manipulate the data. Ensure that the data is sorted in chronological order, with the oldest data point at the top and the most recent data point at the bottom.
By organizing and preparing the data in this way, you will be ready to proceed to the next step of calculating the 3-point moving average.
Read Also: What is a cycle in JS? - Learn about loops and iteration in JavaScript | Your Website Name
Once you have obtained the three data points for your moving average calculation, you can proceed to calculate the average. Here’s how:
1. Add up the three data points: Take the three values you have gathered and add them together.
2. Divide the sum by three: After adding up the three data points, divide the sum by three to calculate the average.

3. Round the average: Round the average to the desired number of decimal places, depending on the level of precision you require.
4. Record the average: Write down the calculated moving average for the current set of data points.
Repeat these steps for each subsequent set of data points in your time series to calculate the moving average at each point.
A 3-point moving average is a calculation that helps smooth out data by taking the average of a set of three consecutive data points.
The 3-point moving average is calculated by adding together the values of three consecutive data points and then dividing by 3.
A 3-point moving average can be useful for highlighting trends in data and filtering out noise or random fluctuations.
A 3-point moving average can be used for any type of data that is ordered and sequential, such as stock prices, temperature readings, or sales figures.
One limitation of the 3-point moving average is that it can smooth out data too much and create lag, making it difficult to spot sudden changes or anomalies in the data.
A 3-point moving average is a method of smoothing out data over a specific period of time by taking the average of the last three data points.

Is the old Philippine money still valid? Many people often wonder if their old Philippine money is still valid. With the introduction of new currency …
Read Article
Frequency of Forex Trading: How Often Do Forex Traders Trade? Forex trading is an exciting and fast-paced world, where traders engage in buying and …
Read Article
How much money can you withdraw from ASB per day? Do you ever find yourself needing to withdraw a large amount of cash from your ASB account? If so, …
Read Article
Can cyclones be predicted? Cyclones are one of the most powerful and destructive natural disasters on our planet. These violent storms, also known as …
Read Article
Reversal Indicator with Alert MT5: What You Need to Know Are you an experienced trader looking for a reliable tool to help you identify potential …
Read Article
Is CNH a good stock to buy? Investing in the stock market can be a lucrative opportunity for individuals looking to grow their wealth. However, …
Read Article


