

Understanding the Key Differences between EOD and Intraday Trading Strategies
Understanding the Difference Between EOD and Intraday Trading In the world of trading, there are two main types of trading strategies: EOD …
Read Article
The S&P 500 is one of the most widely followed stock market indices in the world. Investors and traders watch it closely to gauge the overall health and direction of the stock market. One of the tools used to analyze the S&P 500 is the moving average.
A moving average is a calculation that helps smooth out the fluctuations in a stock or index’s price over a given period of time. It is simply the average of a certain number of past prices, usually taken over a specific time frame. The moving average is often used to identify trends and potential entry or exit points for trades.
The moving average of the S&P 500 can be calculated using different time frames, such as the 50-day moving average or the 200-day moving average. Traders and investors often pay close attention to these moving averages as they can provide valuable insights into the market’s momentum and direction.
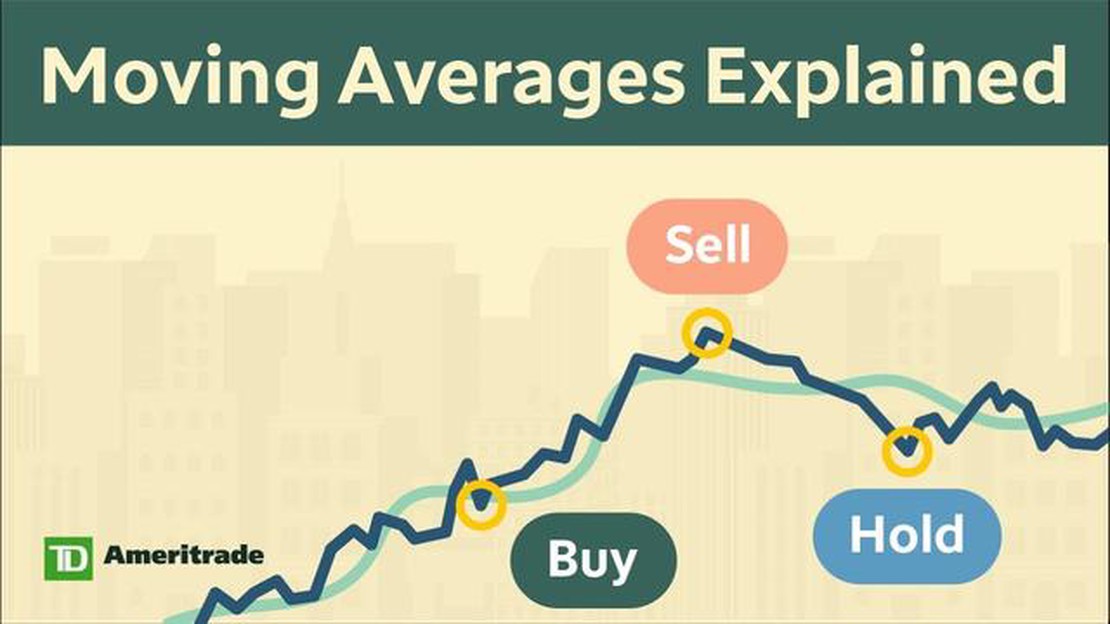
For example, when the S&P 500’s price is above its 50-day moving average, it is often seen as a bullish sign, indicating that the market is in an uptrend. On the other hand, when the price falls below the 50-day moving average, it may suggest a bearish trend, indicating that the market is potentially heading for a downturn.
The moving average is not a perfect indicator and should not be used in isolation. It is just one tool among many used by traders and investors to analyze the stock market and make informed decisions. However, by understanding the moving average of the S&P 500 and how it can be interpreted, investors can gain valuable insights into market trends and potentially improve their trading strategies.
The moving average is a popular technical analysis tool used to smooth out price data and identify trends in financial markets. It is a calculation that takes the average price of a security or index over a specific period of time, usually expressed as a number of days. The moving average is often used by traders and investors to help them make informed decisions about buying or selling assets.
There are different types of moving averages, but the most common ones are the simple moving average (SMA) and the exponential moving average (EMA). The SMA calculates the average price over a fixed number of periods, while the EMA gives more weight to recent prices.
The moving average can be applied to various time frames, ranging from short-term to long-term. Short-term moving averages, such as the 50-day moving average, are often used to identify short-term price trends. On the other hand, long-term moving averages, like the 200-day moving average, are used to identify longer-term trends.

Traders and investors often use moving averages in conjunction with other technical indicators to confirm or validate trading signals. For example, if the price of a security crosses above its 50-day moving average, it may be seen as a bullish signal, indicating that it could continue to rise in the near future. Conversely, if the price crosses below the 200-day moving average, it may be seen as a bearish signal, suggesting that it could continue to decline.
In summary, the moving average is a useful tool in technical analysis that helps traders and investors identify trends and make informed decisions in financial markets.
The Moving Average is a widely used technical indicator in financial analysis. It is a trend-following indicator that helps traders and analysts identify the overall direction of a security or market.
Read Also: Find the broker with the lowest option fees | Compare and choose the best options trading platform
The Moving Average calculates the average price of a security or market over a specified period of time. The most common period used is the 200-day Moving Average, which calculates the average price of the S&P 500 over the past 200 days.
By calculating the average price over a specific time frame, the Moving Average smooths out short-term price fluctuations and reveals the underlying trend of the market. It helps traders and analysts filter out noise and identify significant price movements.
The Moving Average is a lagging indicator, meaning it is based on past price data. It is not predictive in nature, but rather provides information about the historical average price. However, many traders use the Moving Average to generate trading signals when the price crosses above or below the Moving Average.
The Moving Average is a versatile tool that can be customized to fit different trading styles and time frames. Traders can use shorter Moving Averages, such as the 50-day or 20-day Moving Average, for short-term analysis, while longer Moving Averages, such as the 200-day or 50-week Moving Average, are commonly used for long-term trend analysis.
In summary, the Moving Average is a key indicator in technical analysis that helps traders and analysts identify the overall trend of the S&P 500. It smooths out short-term price fluctuations and provides information about the historical average price, allowing traders to filter out noise and identify significant price movements.
There are several types of moving averages that traders and analysts use to analyze the price movements of the S&P 500. These include:
1. Simple Moving Average (SMA): The SMA is the most basic type of moving average. It is calculated by adding up the closing prices of a given period and dividing the sum by the number of periods. The SMA gives equal weight to all the data points, and it is often used to identify support and resistance levels.
2. Exponential Moving Average (EMA): The EMA is a weighted moving average that gives more weight to recent data points. It is calculated using a formula that takes into account the smoothing factor, which determines the weight given to each data point. The EMA reacts more quickly to price changes compared to the SMA, making it more responsive to short-term trends.
Read Also: How much can I withdraw from OANDA? | All about withdrawal limits
3. Weighted Moving Average (WMA): The WMA is another type of moving average that assigns different weights to each data point. The weights decrease as the data points get further from the current period. This type of moving average also reacts more quickly to price changes compared to the SMA.
4. Hull Moving Average (HMA): The HMA is a more advanced type of moving average that aims to reduce lag and noise. It combines weighted moving averages with the square root of the period to create a smoother line. The HMA is designed to be more responsive to recent price movements while reducing false signals.
Traders and analysts may choose to use different types of moving averages depending on their trading strategies and preferences. Each type of moving average has its advantages and disadvantages, and it is important to understand how they work to make informed trading decisions.

The Moving Average of the S&P 500 is a commonly used technical indicator that smooths out price data to identify trends over a specified period of time. It is calculated by adding up the closing prices of the index over a specific number of time periods and then dividing the sum by the number of periods.
The Moving Average of the S&P 500 is important for investors because it helps to identify the overall direction of the market. When the index is trading above its Moving Average, it is generally considered to be in an upward trend, indicating a bullish market. On the other hand, when the index is trading below its Moving Average, it is often seen as a signal of a downward trend, indicating a bearish market.
There are several different types of Moving Averages that can be used for the S&P 500, including the Simple Moving Average (SMA), the Exponential Moving Average (EMA), and the Weighted Moving Average (WMA). The SMA gives equal weight to each data point, while the EMA gives more weight to the most recent data points. The WMA assigns different weights to different data points based on predefined criteria.
Investors can use the Moving Average of the S&P 500 to make trading decisions by looking for crossovers between different Moving Averages. For example, some investors use a strategy called the “Golden Cross,” where they look for the 50-day Moving Average to cross above the 200-day Moving Average as a bullish signal. On the other hand, a crossover of the 50-day Moving Average below the 200-day Moving Average is often considered a bearish signal.
The Moving Average of the S&P 500 can be used as a standalone indicator, but it is often used in conjunction with other technical indicators and analysis techniques to confirm or support trading decisions. Some common indicators that are used in combination with the Moving Average include trendlines, support and resistance levels, and volume analysis.
The Moving Average of the S&P 500 is a commonly used technical analysis tool that calculates the average price of the index over a specified period of time. It is used to smooth out price fluctuations and identify trends in the market.
The Moving Average of the S&P 500 is calculated by adding up the closing prices of the index over a specified period of time and dividing it by the number of periods. For example, a 50-day moving average would add up the closing prices of the index over the past 50 days and divide it by 50.

Understanding the Difference Between EOD and Intraday Trading In the world of trading, there are two main types of trading strategies: EOD …
Read Article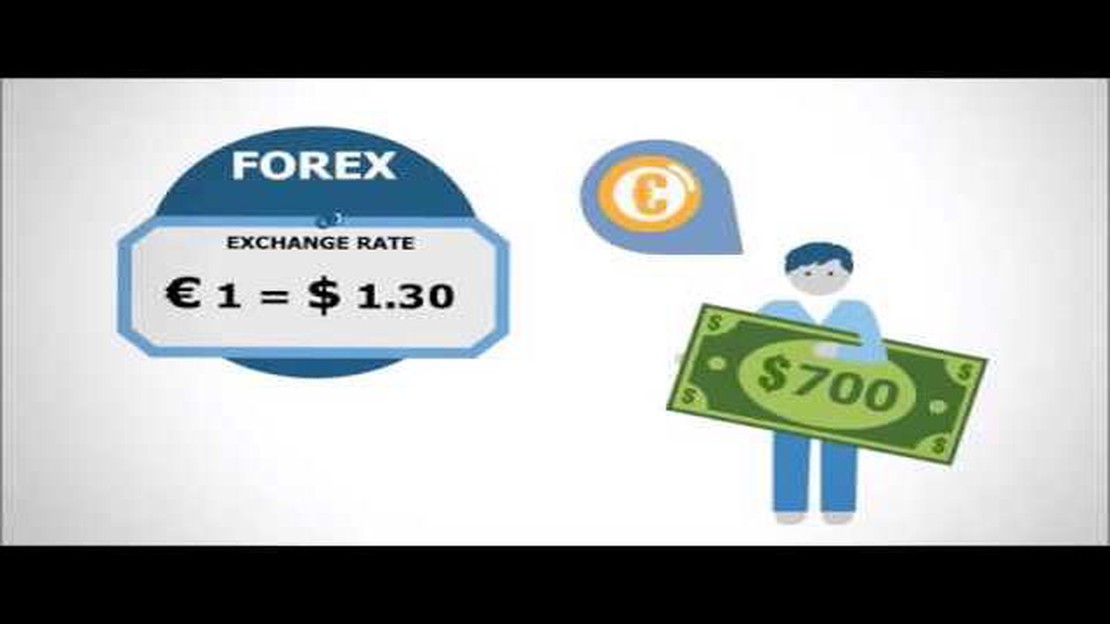
Understanding the Value of Forex and Its Significance The foreign exchange market, commonly known as Forex, plays a vital role in the global economy. …
Read Article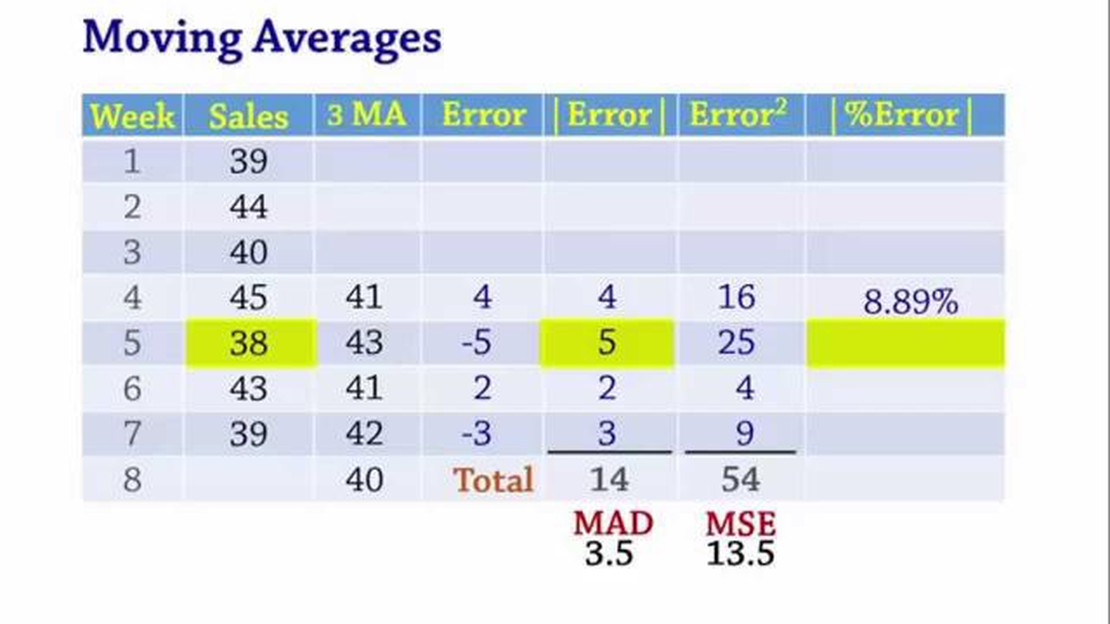
Understanding the Concept of Moving Average Monthly Data When analyzing monthly data, it can often be difficult to discern underlying trends due to …
Read Article
Understanding Uptrend and Downtrend in Forex Trading Forex market is known for its volatility and constantly changing trends. Understanding these …
Read Article
Future of Fmcc As technology continues to advance at an unprecedented rate, it is no surprise that the future of FMCC (Facilities Management and …
Read Article
Side Effects of IV CT Scan: What You Need to Know An intravenous (IV) CT scan is a diagnostic procedure that uses a contrast material injected into a …
Read Article


