


Do Big Traders Utilize Stop Loss? Exploring Risk Management Strategies
Do big traders use stop loss? When it comes to trading in the financial markets, risk management is a crucial aspect that separates successful traders …
Read Article
When analyzing monthly data, it can often be difficult to discern underlying trends due to fluctuations and volatility. This is where moving averages come into play. A moving average is a statistical calculation that helps to smooth out these fluctuations and provide a clearer picture of long-term trends.
The concept of a moving average is relatively simple. It involves taking the average of a set number of data points over a specified time period and then recalculating this average as new data becomes available. By doing so, we are able to eliminate any short-term noise and focus on the overall direction of the data.
There are different types of moving averages, including simple moving averages (SMA) and exponential moving averages (EMA). Simple moving averages calculate the average based on an equally-weighted set of data points, while exponential moving averages give more weight to recent data points.
Moving averages can be useful in a variety of applications, such as financial analysis, stock market forecasting, and market research. They can help identify potential trends, support or resistance levels, and provide insight into market sentiment.
Overall, understanding moving averages is essential for anyone looking to analyze and interpret monthly data trends. By eliminating short-term noise and focusing on the underlying direction, moving averages can provide valuable insights and help make more informed decisions.
So, whether you are an investor, researcher, or analyst, incorporating moving averages into your analysis toolkit can greatly enhance your understanding of monthly data and help uncover hidden trends that may otherwise go unnoticed.
The moving average is a widely used statistical technique that helps to identify and understand trends in data. It is particularly useful for analyzing time series data, where the values are collected and recorded at regular intervals over time. By calculating the moving average, we can smooth out any short-term fluctuations in the data and highlight the underlying trends.
When calculating the moving average, we take a specified number of data points and find the average of those points. We then move one data point forward and repeat the process. This creates a series of average values that can be plotted on a graph, giving us a visual representation of the data trends.
The moving average is typically used to identify the trend direction in the data. If the moving average is increasing, it suggests that the data is trending upwards. Conversely, if the moving average is decreasing, it suggests that the data is trending downwards.
There are different types of moving averages, including the simple moving average (SMA) and the exponential moving average (EMA). The SMA calculates the average of a specified number of data points, while the EMA assigns more weight to recent data points.
Read Also: Discover the Top Trade Management Software for MT4 | Boost Your Trading Efficiency
By analyzing the moving average, we can gain insights into the behavior of the data and make informed decisions. For example, a moving average can help us determine the optimal time to buy or sell a stock, or to understand the average monthly sales for a business.
In conclusion, understanding the moving average is essential for analyzing trends in monthly data. By calculating and analyzing the moving average, we can identify patterns, make predictions, and gain valuable insights into the data.
When analyzing data, it’s important to identify any underlying trends that may exist. One way to do this is by exploring monthly data trends. By examining the data on a monthly basis, you can identify patterns, fluctuations, and any seasonality that may be present.
A common technique used to analyze monthly data is the moving average. The moving average calculates the average of a certain number of data points within a specified time frame. This helps to smooth out any noise or random fluctuations in the data, allowing you to see the overall trend more clearly.
Read Also: How to Access Extended Trading Hours on Etrade: A Step-by-Step Guide
To explore monthly data trends using a moving average, you can start by collecting your monthly data points. This data can be collected from a variety of sources, such as sales figures, website traffic, or financial data. Once you have collected your data, you can calculate the moving average by selecting a specific time frame and calculating the average for each overlapping set of data points within that time frame.
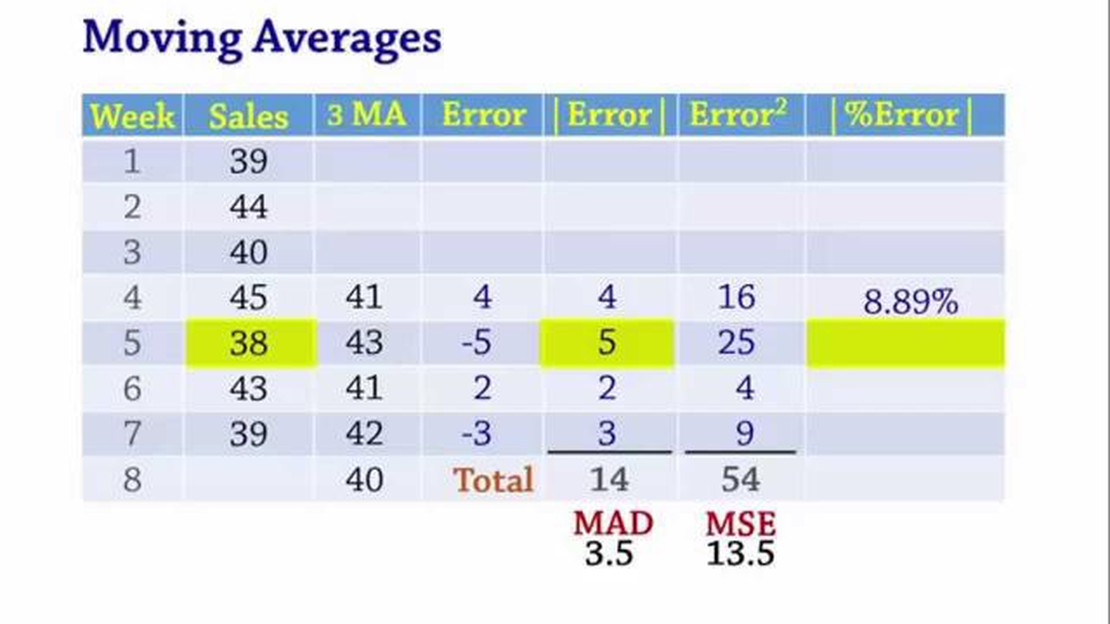
For example, if you are analyzing sales data for the past year, you could calculate the moving average for a 3-month time frame. This means you would take the average of the sales figures for the first 3 months, then the average for the next 3 months, and so on. This will give you a series of average values that represent the overall trend of the sales data.
Once you have calculated the moving average, you can plot it on a graph to visualize the trend. This can help you identify any upward or downward trends, as well as any seasonality that may be present. You can also compare the moving average to the original data points to see how well it represents the overall trend.
Exploring monthly data trends using a moving average can provide valuable insights into the behavior and patterns of your data. It can help you make informed decisions, identify areas for improvement, and predict future trends. By taking the time to analyze your data on a monthly basis, you can gain a better understanding of its underlying trends and use that knowledge to drive your business forward.
A moving average is a statistical technique used to analyze data trends over a specific period of time. It is calculated by taking the average of a certain number of data points within that time frame and moving it forward as new data becomes available.

A moving average is calculated by adding up a certain number of data points within a specific time frame and dividing the sum by the number of data points. This average is then moved forward as new data points are added and old data points are dropped.
Moving average is used to analyze data trends because it smooths out the fluctuations in the data and provides a clearer picture of the overall trend. It helps to identify long-term patterns and remove the noise or random variations in the data.
Moving average can be helpful in making decisions by providing insights into the direction and strength of a trend. By analyzing the moving average, one can identify whether a trend is gaining momentum or losing steam. This information can be used to make informed decisions about investments, resource allocations, and other strategic actions.

Do big traders use stop loss? When it comes to trading in the financial markets, risk management is a crucial aspect that separates successful traders …
Read Article
Forex Trading during the London Open hour The London open is a crucial time for forex traders around the world. As one of the major financial centers, …
Read Article
Mastering the Strategy of Index Options Trading If you’re looking to delve into the world of options trading, then understanding the strategy of index …
Read Article
Discover the HFM Trading Platform: Your Gateway to Financial Success Are you looking for a reliable trading platform? Look no further. The HFM trading …
Read Article
Is binary option legal in India? Binary options trading has gained significant popularity in recent years due to its potential for high returns on …
Read Article
Choosing the Best MT4 Indicator for Successful Trading In the world of online trading, having the right tools at your fingertips can mean the …
Read Article


