


10 Important Questions to Ask a Trader
Good Questions to Ask a Trader Are you considering investing your hard-earned money in the stock market? Before taking the plunge, it is crucial to …
Read Article
When it comes to statistical process control (SPC), the upper control limit (UCL) plays a crucial role in monitoring and maintaining the quality of a process. The UCL represents the highest acceptable value for a process parameter, beyond which the process is considered out of control. It serves as a boundary that helps identify any significant variation or deviation from the desired target.
The UCL is typically derived from historical data, using statistical methods such as control charts. It is set at a level that is unlikely to be exceeded under normal operating conditions. By monitoring the process and comparing the observed values with the UCL, any potential issues or abnormalities can be detected early on, allowing for timely corrective actions to be taken.
Understanding the meaning and significance of the UCL is essential for process improvement and ensuring product quality. When the process operates within the control limits (i.e., between the upper and lower control limits), it is considered to be in a state of statistical control. This indicates that the process is stable, predictable, and producing consistent results. On the other hand, if the process exceeds the UCL, it suggests the presence of special causes of variation that require investigation and intervention.
In addition to its role in process monitoring, the UCL also helps determine the capability of a process. By calculating the gap between the UCL and the target value, known as the process capability index, organizations can assess how well a process is meeting customer requirements. A higher capability index indicates a more capable process, while a lower index signals the need for improvement. Therefore, understanding and controlling the UCL is vital for businesses looking to achieve and maintain high levels of quality and customer satisfaction.
In conclusion, the upper control limit is a critical tool in statistical process control that helps monitor process performance, detect variations, and ensure quality. It serves as a boundary that separates normal variation from special causes, allowing organizations to take appropriate actions to maintain or improve their processes. By understanding its meaning and significance, businesses can achieve better process control, enhance their capability, and meet customer expectations.
In statistical process control, the upper control limit (UCL) is a key concept used to evaluate and monitor the performance of a process over time. It is a statistical boundary that separates the expected variation of a process from any unusual variation that may indicate a special cause of variation.
The UCL is typically derived from statistical calculations based on data collected from the process. It represents the highest value that the process is expected to achieve under normal, stable conditions. Any data point that exceeds the UCL suggests that the process is experiencing an unusual variation, often indicating the presence of a special cause that needs to be investigated and addressed.
Read Also: What is the average forex trader salary in South Africa?
To determine the UCL, various statistical methods can be used, such as control charts or capability analysis. These methods take into account the inherent variation in the process data and calculate the UCL based on the desired level of control and the acceptable risk of a false alarm. It is important to choose an appropriate statistical method and determine the correct UCL to ensure effective process monitoring and control.
The UCL acts as a control mechanism for identifying and addressing potential problems in a process. It helps to detect and prevent quality issues, improve product consistency, and reduce defects and waste. By monitoring data against the UCL, organizations can take proactive measures to maintain process stability, meet customer requirements, and achieve operational excellence.
In summary, the upper control limit is a statistical boundary that represents the expected highest value of a process under normal conditions. It serves as a tool for process monitoring and control, helping to identify and address unusual variations that may indicate the presence of special causes. By effectively utilizing the UCL, organizations can improve their processes, enhance product quality, and drive continuous improvement.
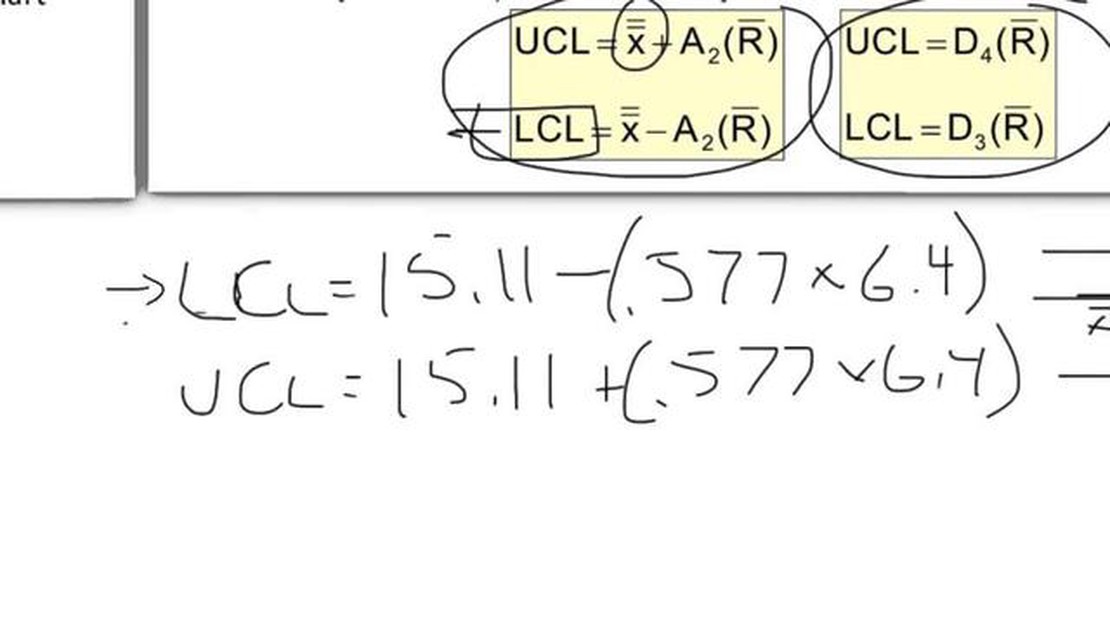
The upper control limit (UCL) is a statistical calculation used in quality control to determine the maximum acceptable deviation from the mean value of a process. It is derived from the data collected during the control charting process and is typically represented as a horizontal line on the control chart.
The purpose of the UCL is to provide a clear visual reference point for evaluating the performance of a process. By comparing the plotted data points to the UCL, managers and quality control professionals can quickly identify any variations or trends that may indicate a process is out of control.
The UCL is typically set based on the desired level of process performance and the acceptable level of variability. It can be calculated using various statistical methods, such as the mean plus a specified number of standard deviations or based on historical data. The specific method used to calculate the UCL depends on the characteristics of the process being monitored.
Read Also: Is Night Trading a Good Idea? Pros and Cons of Trading Stocks at Night
Overall, the UCL serves as a tool to monitor and improve the quality of a process. It helps identify when interventions or adjustments are necessary to maintain consistent and acceptable levels of performance.
The Upper Control Limit is the highest acceptable value for a process control chart and signifies the boundary beyond which the process is considered out of control.
The Upper Control Limit is important because it helps identify when a process is deviating from its intended performance. It serves as a visual indicator to monitor and control the process, ensuring that it stays within acceptable limits.

The Upper Control Limit is typically calculated using statistical techniques, such as three standard deviations above the mean or using control charts. The specific calculation method may vary depending on the type of data and the control chart being used.
If a data point exceeds the Upper Control Limit, it suggests that the process is out of control and there may be a special cause of variation. This indicates a need for investigation and corrective action to bring the process back into control.
Yes, the Upper Control Limit can change over time. As a process improves or changes, the variability and performance of the process may change, necessitating a different Upper Control Limit. It is important to regularly review and update control limits to ensure they reflect the current state of the process.

Good Questions to Ask a Trader Are you considering investing your hard-earned money in the stock market? Before taking the plunge, it is crucial to …
Read Article
Is Ichimoku a reliable indicator for trading? The Ichimoku Cloud, also known as Ichimoku Kinko Hyo, is a popular technical analysis tool used by …
Read Article
What is the most accurate indicator for intraday? When it comes to intraday trading, having the right indicator is crucial. Intraday traders rely on …
Read Article
What is an example of a promo code? Promo codes are a popular digital form of promotion used by businesses to attract customers and boost sales. These …
Read Article
Understanding American European Terms in Forex Trading If you are new to forex trading, understanding the different terms and lingo used in the …
Read Article
Discover the OBR Trading Strategy Are you interested in the world of trading but unsure where to start? Look no further than the OBR Trading Strategy. …
Read Article


