


What is Total Compensation Cost? Understanding the Impact on Employee Benefits
What Is Total Compensation Cost? When considering employee benefits, it is crucial for organizations to understand the concept of total compensation …
Read Article
The moving average method is a commonly used statistical technique in data analysis and forecasting. It is a mathematical calculation that is used to analyze and identify patterns in a set of data over a specific time period. This method is especially useful in smoothing out short-term fluctuations and determining trends over time.
At its core, the moving average method calculates the average value of a set of data points over a given time period. This time period is often referred to as the “window” or “lag”. By taking the average of the data points within the window, the method provides a clearer picture of the trend or pattern that may be hidden within the raw data.
The moving average method can be applied to various types of data, including financial data, stock prices, sales figures, and even weather data. It can be used to identify and predict trends, as well as to evaluate the impact of certain events or variables on the data. Additionally, the method can be used as a forecasting tool to predict future values based on past trends.
There are different types of moving averages, including the simple moving average (SMA) and the exponential moving average (EMA). Each type has its own advantages and disadvantages, and the choice of which to use depends on the specific analysis and data being studied. The moving average method is widely used in fields such as finance, economics, and operations research, as it provides a valuable tool for analyzing and understanding patterns in data.
The moving average method is a commonly used statistical technique for analyzing time series data. It involves calculating the average of a set of data points within a specific time period to identify trends and patterns. This method is particularly useful in financial analysis, forecasting, and trend analysis.
The moving average method works by taking the average of a certain number of data points and then moving this average along the data set. This smoothing technique removes the fluctuations and noise in the data, allowing analysts to identify underlying trends more easily. The moving average is calculated by adding up a specified number of data points and dividing the sum by the number of data points.
There are different types of moving averages that can be used, such as the simple moving average (SMA) and the exponential moving average (EMA). The SMA gives equal weight to all data points within the time period, while the EMA gives more weight to recent data points.
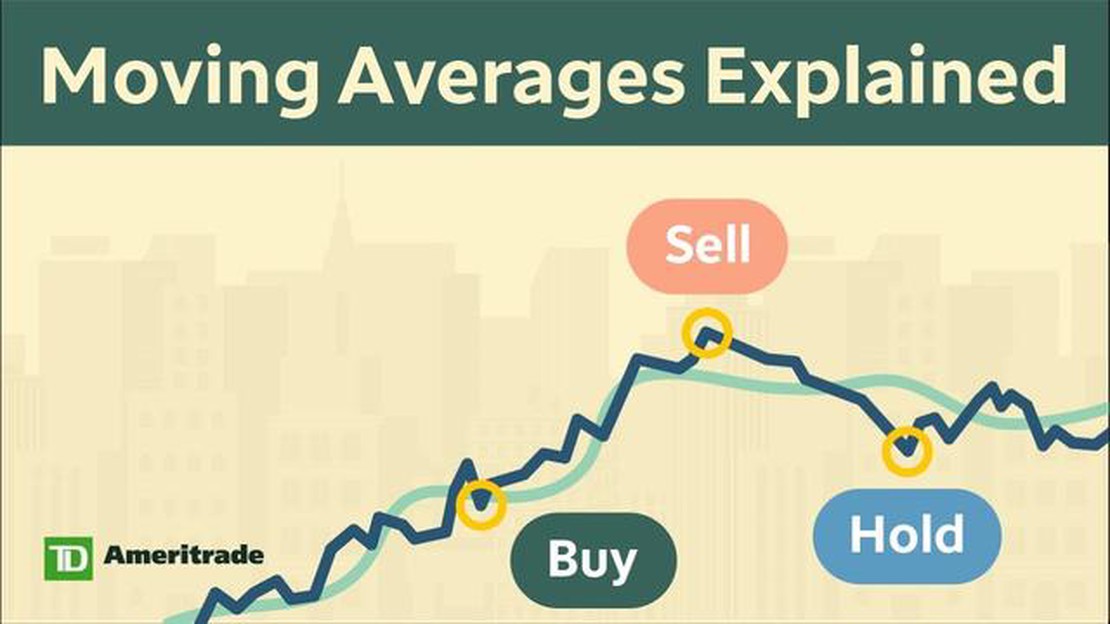
The moving average method is widely used in technical analysis to identify support and resistance levels, as well as to generate buy and sell signals. Traders and investors use moving averages to determine the direction of a trend and to filter out noise in the financial markets.
In conclusion, the moving average method is a powerful tool for analyzing time series data and identifying trends. By smoothing out the data and removing noise, it allows analysts to make more accurate predictions and decisions. Whether you’re a trader, investor, or analyst, understanding the moving average method can greatly enhance your ability to interpret financial data and make informed decisions.

In financial analysis, the moving average is a commonly used statistical calculation that helps to identify trends and patterns in data over a certain period of time. It is used to smooth out fluctuations and noise in data to make it easier to analyze and interpret. Moving averages are widely used in various fields, such as stock market analysis, economic forecasting, and technical analysis.
Read Also: Discover the Most Popular Alternative Investment Options
The concept of moving averages is based on the idea of averaging data points over a specific time period, which creates a moving average line or curve. This line represents the overall trend of the data and helps to filter out short-term fluctuations. By using different time periods for the moving average calculation, analysts can gain insights into different aspects of the data.
The calculation of a moving average involves summing up a specific number of data points and dividing the sum by the number of data points. For example, a simple moving average of 5 days would involve summing up the closing prices of the last 5 days and dividing the sum by 5. This calculation is done for each day, resulting in a series of moving average values.
There are different types of moving averages, such as the simple moving average (SMA), exponential moving average (EMA), and weighted moving average (WMA). The choice of which type to use depends on the specific needs and preferences of the analyst.
Moving averages serve multiple purposes in data analysis. They can be used to identify trends, detect support and resistance levels, generate trading signals, and smooth out noisy data. They are also used as a basis for other technical indicators, such as the moving average convergence divergence (MACD) and the average true range (ATR).
In conclusion, understanding the concept and calculation of moving averages is essential for anyone involved in financial analysis. By using moving averages, analysts can gain valuable insights into the underlying trends and patterns in data, helping them make informed decisions and predictions.
Moving averages are widely used in financial analysis to identify trends and support decision-making processes. By smoothing out price data over a specific time period, moving averages help to remove noise and highlight the underlying trend.
One common application of moving averages is in the analysis of stock market prices. Traders and investors use moving averages to identify potential buying or selling opportunities. For example, a crossover between a shorter-term moving average and a longer-term moving average can signal a change in trend, indicating the potential for a buying or selling opportunity.
Moving averages can also be used to define support and resistance levels. When a stock price approaches its moving average, it may find support or resistance, depending on whether the price is above or below the moving average. This information can be useful in determining potential entry or exit points for trades.
Read Also: Current Exchange Rate for the Thai Baht
Besides stock market analysis, moving averages are also used in other areas of financial analysis, such as the analysis of economic indicators, foreign exchange rates, and commodity prices. The versatility of moving averages makes them a valuable tool for understanding and interpreting financial data.

It’s important to note that moving averages are not foolproof indicators and should be used in conjunction with other technical and fundamental analysis tools. They can provide valuable insights into market trends, but it’s essential to consider other factors and indicators before making any investment decisions.
The moving average method is a statistical technique used to analyze time series data. It involves calculating the average value of a series of data points over a specified period of time, and then using this average value to make predictions or identify trends in the data.
The moving average method is applied by first selecting a period of time over which the moving average will be calculated. Then, the average value of the data points within this time period is calculated at each point in time. This process is repeated for each data point in the series, resulting in a series of moving averages. These moving averages can be used to make predictions or identify trends in the data.
The period used in the moving average method determines the length of time over which the average value is calculated. A shorter period will respond more quickly to changes in the data, but may be more sensitive to random fluctuations. A longer period will be more stable, but may not respond as quickly to changes in the data.
Yes, the moving average method can be used for forecasting. By calculating the moving average of past data points, it is possible to identify trends or patterns in the data that can be used to make predictions about future values.
Yes, the moving average method has a few limitations. It can be influenced by outliers or extreme values in the data, and it may not accurately capture sudden changes or shifts in the data. Additionally, the method assumes that the future values of the data will follow a similar pattern or trend as the past values, which may not always be the case.
The moving average method is a statistical technique used to analyze and forecast data by calculating the average value of a series of data points over a certain period of time.

What Is Total Compensation Cost? When considering employee benefits, it is crucial for organizations to understand the concept of total compensation …
Read Article
Etrade fees for micro futures If you’re a trader looking to get involved in the futures market, you may be considering Etrade as your broker. Etrade …
Read Article
Understanding Bos and ChoCh in Forex Trading Forex trading, also known as foreign exchange trading, is the buying and selling of currencies with the …
Read Article
Can I trade commodities in Zerodha? Commodities trading has become increasingly popular among investors in recent years. And if you are a trader in …
Read Article
What are Employee Stock Options Worth? Employee stock options are becoming an increasingly popular form of compensation for employees at companies of …
Read Article
What is the employee discount on stock options? Employee discount on stock options is a valuable benefit that many companies offer to their employees. …
Read Article


