


Top Banks That Trade Forex: A Comprehensive Guide
Top Banks Trading Forex Forex trading, also known as foreign exchange trading, is the global market for buying and selling different currencies. It is …
Read Article

The Keltner Channel is a technical analysis tool that is commonly used in binary options trading strategies. It is a volatility-based indicator that helps traders identify overbought and oversold levels, as well as potential trend reversals. Understanding how to effectively use the Keltner Channel can greatly enhance a trader’s ability to make profitable trades.
Created by Chester Keltner in the 1960s, the Keltner Channel consists of three lines: an upper band, a middle band, and a lower band. The middle band is typically a simple moving average, while the upper and lower bands are calculated based on the average true range (ATR) of the asset being traded. The width of the channel is determined by the ATR, making it responsive to changes in price volatility.
The Keltner Channel provides valuable information about the current state of the market. When prices are trading near the upper band, it suggests that the market is overbought and a reversal to the downside may be imminent. Conversely, when prices are trading near the lower band, it indicates that the market is oversold and a reversal to the upside may be on the horizon.
In addition to identifying overbought and oversold conditions, the Keltner Channel can also be used to determine the strength of a trend. If the price consistently stays above the middle band and the upper band widens, it suggests a strong uptrend. On the other hand, if the price consistently stays below the middle band and the lower band widens, it indicates a strong downtrend.
Traders can use the Keltner Channel in combination with other technical indicators or chart patterns to confirm signals and improve the accuracy of their trading strategy. However, it is important to note that like any other indicator, the Keltner Channel is not foolproof and should be used in conjunction with other analysis techniques to make informed trading decisions.
Overall, the Keltner Channel is a powerful tool for traders looking to identify potential reversals and trends in the binary options market. By understanding how to interpret the different bands and using them in combination with other indicators, traders can greatly improve their chances of success. However, it is important to always use proper risk management techniques and conduct thorough analysis before placing any trades.
The Keltner Channel is a popular technical indicator used in financial trading, especially in binary options strategy. It is named after Chester W. Keltner, who first introduced it in the 1960s. The Keltner Channel consists of three lines: the middle line, the upper line, and the lower line.
The middle line is a moving average of the price, commonly set at a 20-day period. It represents the average price over a certain period and provides a baseline for the channel. The upper line is calculated as the middle line plus a multiple of the average true range (ATR). The ATR measures the volatility in the market and is usually set to a multiple of 1.5 to 2.5. The lower line is calculated by subtracting the same multiple of the ATR from the middle line.

The Keltner Channel is often used to identify overbought and oversold conditions in the market and to generate trading signals. When the price moves above the upper line, it is considered overbought, indicating a potential sell signal. Conversely, when the price moves below the lower line, it is considered oversold, indicating a potential buy signal. Traders may also look for price breakouts outside the channel as a signal of trend continuation or reversal.
Read Also: Understanding the Black Scholes formula for FX options: Everything you need to know
Overall, the Keltner Channel is a versatile tool that can help traders identify potential trade setups and manage risk. It is used by both beginners and experienced traders to make informed trading decisions.
The Keltner Channel is a technical indicator that can be used in binary strategy to identify potential trading opportunities. It is based on the concept of volatility, and consists of three bands: an upper band, a middle band, and a lower band.
Traders can use the Keltner Channel to determine whether an asset is overbought or oversold, and to identify potential entry and exit points. Here are some steps on how to use the Keltner Channel in binary strategy:
2. Calculate the upper and lower bands: The upper and lower bands are typically calculated by adding or subtracting a multiple of the Average True Range (ATR) from the middle band. The ATR measures price volatility, and traders can adjust the multiplier to suit their risk tolerance and trading style. 3. Identify overbought and oversold conditions: By comparing the asset’s price to the Keltner Channel bands, traders can determine whether the asset is overbought or oversold. If the price is near or above the upper band, it may be a signal that the asset is overbought and a potential reversal or correction could occur. Conversely, if the price is near or below the lower band, it may be a signal that the asset is oversold and a potential reversal or bounce could occur. 4. Look for potential entry and exit points: Traders can use the Keltner Channel to identify potential entry and exit points. For example, when the price crosses the upper band from above, it may be a signal to sell or go short. Conversely, when the price crosses the lower band from below, it may be a signal to buy or go long. 5. Consider other technical indicators: While the Keltner Channel can be a useful tool in binary strategy, traders should also consider other technical indicators and factors before making trading decisions. It is important to analyze the overall market conditions, trend, volume, and other relevant factors to confirm or validate the signals generated by the Keltner Channel.
Read Also: Discover How Much Kraken USDT Earns | Latest Insights and Analysis
In conclusion, the Keltner Channel is a valuable tool for binary strategy traders to identify potential trading opportunities. By understanding how to calculate and interpret the Keltner Channel bands, traders can gain insights into market volatility, overbought and oversold conditions, and potential entry and exit points. However, it is important to combine the use of the Keltner Channel with other technical indicators and analysis to make informed trading decisions.

The Keltner Channel is a technical analysis tool that is used to identify potential price reversals and assess market volatility. It consists of three lines: the middle line, which is a moving average, and the upper and lower lines, which are derived from the average true range (ATR) indicator.
The Keltner Channel can be useful in binary strategy as it helps traders identify potential trend reversals and find optimal entry and exit points. By analyzing the width of the channel, traders can also assess market volatility and adjust their trading strategy accordingly.
The main difference between the Keltner Channel and the Bollinger Bands is the method of calculating the upper and lower lines. The Keltner Channel uses the average true range (ATR) indicator, while the Bollinger Bands use the standard deviation. Additionally, the Keltner Channel tends to be smoother and less volatile compared to the Bollinger Bands.
Yes, the Keltner Channel can be used for other financial instruments besides binary options. It is commonly used in forex trading, stocks, and futures markets. However, it is important to note that different instruments may require adjustments to the parameters of the Keltner Channel to suit their specific characteristics.
Some common trading strategies using the Keltner Channel include the breakouts strategy and the squeeze strategy. The breakout strategy involves entering a trade when the price breaks above or below the upper or lower line of the Keltner Channel, respectively. The squeeze strategy involves entering a trade when the width of the channel is narrow, indicating low volatility, and then waiting for a breakout.
The Keltner Channel is a technical analysis tool that helps traders identify potential entry and exit points in the market. It is made up of an upper band, a middle line, and a lower band, which are calculated using the Average True Range (ATR) indicator.

Top Banks Trading Forex Forex trading, also known as foreign exchange trading, is the global market for buying and selling different currencies. It is …
Read Article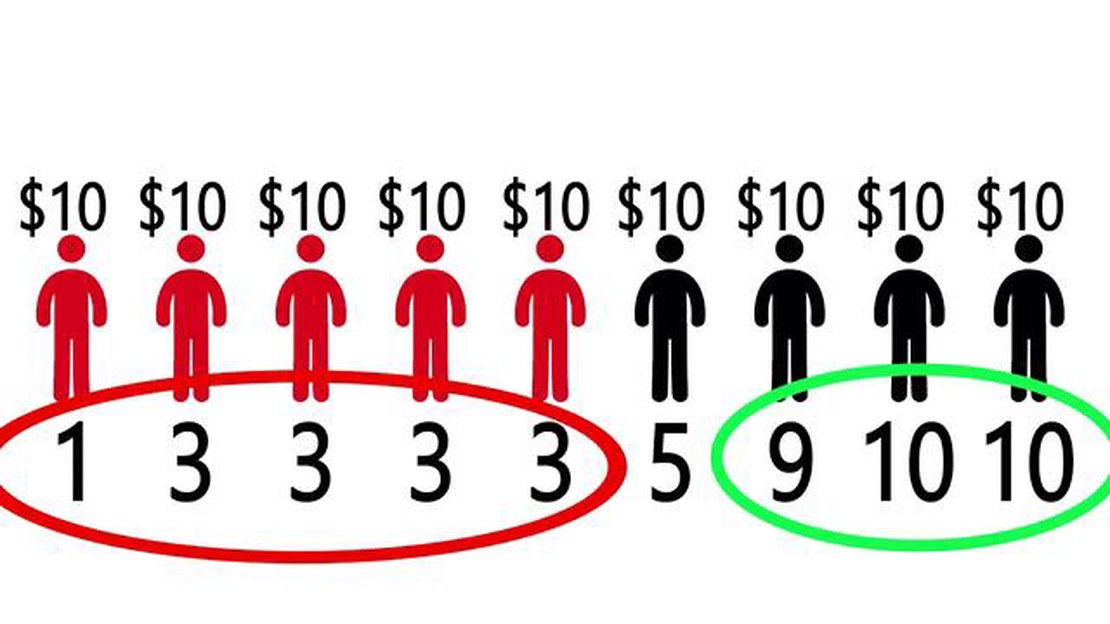
Advantages and Disadvantages of the Average of Averages The concept of using the average of averages is a common practice in statistical analysis, but …
Read Article
Cost of Shipping a Balikbayan Box Shipping a Balikbayan box to the Philippines is a common practice for Filipinos living and working abroad. These …
Read Article
What is the Ideal RSI Level for Forex Trading? When it comes to forex trading, one of the most commonly used technical indicators is the Relative …
Read Article
Understanding Quantitative Analysis in Trading Quantitative analysis plays a crucial role in trading. It is a systematic approach to analyzing market …
Read Article
Understanding Dilution from Employee Stock Option Plans When it comes to managing equity, employee stock option plans (ESOPs) play a significant role. …
Read Article


