


Reasons executives are given stock options and their benefits
Reasons Why Executives are Given Stock Options Stock options are a popular form of compensation for executives in many companies. These options give …
Read Article
In the world of financial markets, trading strategies are constantly evolving to adapt to changing conditions. One popular tool used by traders is the 50 Day Simple Moving Average (SMA), which is a technical analysis indicator that can provide valuable insights into market trends.
The 50 Day SMA is a calculation of the average price of a security over the past 50 trading days. It is a commonly used indicator by both short-term and long-term traders, as it helps to smooth out price fluctuations and identify trends. By plotting the 50 Day SMA on a price chart, traders can easily visualize whether the price of a security is trending upwards, downwards, or sideways.
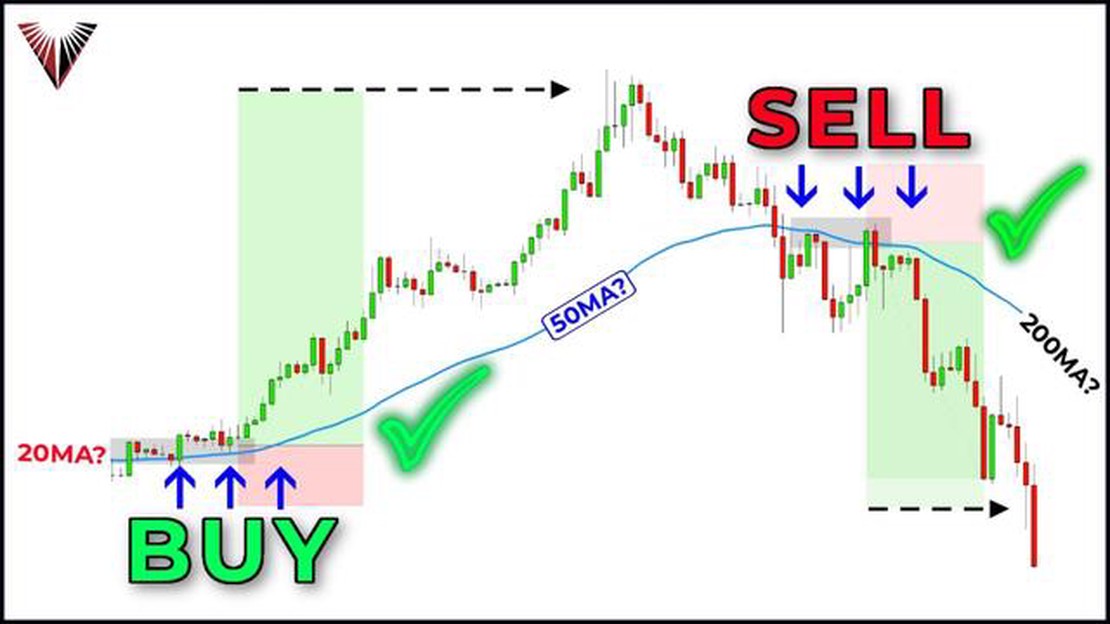
One of the main benefits of using the 50 Day SMA is its ability to act as a support or resistance level. When the price of a security is trading above the 50 Day SMA, it is considered a bullish signal, indicating that the trend is upwards. Conversely, when the price is trading below the 50 Day SMA, it is a bearish signal, indicating a downward trend.
Traders also use the 50 Day SMA as a tool for generating buy and sell signals. For example, when the price of a security crosses above the 50 Day SMA, it may signal a buy signal, as it suggests that the bullish trend is gaining strength. On the other hand, when the price crosses below the 50 Day SMA, it may indicate a sell signal, as it suggests that the bearish trend is becoming dominant.
Ultimately, incorporating the 50 Day SMA into your trading strategy can help you make more informed decisions and improve your overall trading performance. By understanding the trends and support/resistance levels generated by the 50 Day SMA, traders can better time their entries and exits, increasing the likelihood of successful trades.
Remember, the 50 Day SMA should be used in combination with other technical analysis tools and indicators to confirm signals and reduce the risk of false signals. It is also important to keep in mind that the 50 Day SMA is just one of many tools available to traders and should not be used in isolation. Successful trading requires a comprehensive approach and careful analysis of multiple factors.
So, whether you are a beginner or an experienced trader, taking the time to understand and incorporate the 50 Day SMA into your trading strategy can help you navigate the complex world of financial markets with more confidence and precision.
When it comes to trading, understanding the 50 Day Simple Moving Average (SMA) can be crucial. The SMA is a widely used technical analysis indicator that helps traders identify trends and make informed decisions.

The 50 Day SMA is calculated by adding up the closing prices of a security over the past 50 trading days and dividing the sum by 50. It provides traders with a smoothed line that represents the average price over the specified period.
One of the key reasons why the 50 Day SMA is important is because it helps traders identify support and resistance levels. When the price of a security is trading above its 50 Day SMA, it is considered to be in an uptrend and the 50 Day SMA acts as a support level. On the other hand, if the price is trading below the 50 Day SMA, it is in a downtrend and the 50 Day SMA acts as a resistance level. Understanding these levels can help traders set entry and exit points for their trades.
Another important aspect of the 50 Day SMA is its ability to provide traders with signals to buy or sell a security. When the price crosses above the 50 Day SMA, it is considered a bullish signal, indicating that the security may continue to rise in price. Conversely, when the price crosses below the 50 Day SMA, it is considered a bearish signal, indicating that the security may continue to decline in price. Traders often use these crossovers as an opportunity to enter or exit a trade.
Read Also: Understanding the Basics of Stock Option Transactions | Your Guide to Stock Options
Furthermore, the 50 Day SMA can also act as a dynamic level of support or resistance. As the price of a security changes over time, the 50 Day SMA adjusts accordingly. Traders can use this dynamic level to gauge the strength of a trend and make more accurate trading decisions.
In conclusion, understanding the 50 Day Simple Moving Average (SMA) is essential for traders looking to improve their trading strategies. It provides valuable insights into support and resistance levels, generates buy and sell signals, and acts as a dynamic level in analyzing trends. By incorporating the 50 Day SMA into their analysis, traders can make more informed and profitable trading decisions.
The 50 Day Simple Moving Average (SMA) is a technical indicator that traders use to analyze trends and make informed trading decisions. It is calculated by summing up the closing prices of an asset over the last 50 trading days and dividing the total by 50.
The SMA provides traders with a smoothed line that represents the average price of an asset over a specific time period. It helps to filter out short-term price fluctuations and highlight the overall direction of the trend.
Read Also: What is FFMC: A Comprehensive Guide to Understanding FFMCs
Traders often use the 50 Day SMA as a reference point to determine whether a stock or other financial instrument is in an uptrend, downtrend, or trading sideways. When the price of an asset is above the 50 Day SMA, it is considered bullish, indicating a potential buying opportunity. Conversely, when the price falls below the 50 Day SMA, it is considered bearish, suggesting a potential selling opportunity.
The 50 Day SMA can also act as a support or resistance level. During an uptrend, the 50 Day SMA may act as a support level, preventing the price from falling below it. Conversely, during a downtrend, the 50 Day SMA may act as a resistance level, preventing the price from rising above it.
Traders often use the 50 Day SMA in conjunction with other technical indicators, such as the 200 Day SMA, to confirm trends and generate trading signals. Crossovers between the 50 Day SMA and the 200 Day SMA are considered significant events and can indicate a change in the long-term trend.

It is important to note that the 50 Day SMA is just one tool in a trader’s arsenal and should not be used in isolation. Traders should consider other factors, such as volume, market sentiment, and news events, before making trading decisions based solely on the 50 Day SMA.
| Pros | Cons |
|---|---|
| Provides a smoothed average of an asset’s price over a specific time period | Can lag behind price movements due to its lagging nature |
| Helps to identify trends and potential buying or selling opportunities | Can generate false signals during periods of high volatility |
| Can act as a support or resistance level | Does not take into account other market factors |
The 50 Day Simple Moving Average (SMA) is a technical indicator that shows the average price of a security over the past 50 trading days. It is calculated by adding together the closing prices of the security for the past 50 days and then dividing that sum by 50. The SMA is used by traders and investors to identify trends and potential support or resistance levels.
The 50 Day SMA is just one of many different types of moving averages, but it is commonly used by traders and investors because it provides a relatively short-term view of a security’s price movement. Other moving averages, such as the 200 Day SMA, provide longer-term views. The choice of which moving average to use depends on a trader’s investment strategy and time horizon.
The 50 Day SMA can impact a trading strategy in a few ways. For example, when the price of a security is above the 50 Day SMA, it can be seen as a bullish signal, indicating that the price may continue to rise. On the other hand, when the price is below the 50 Day SMA, it can be seen as a bearish signal, indicating that the price may continue to fall. Traders often use the 50 Day SMA as a reference point for setting stop-loss orders or determining when to enter or exit a trade.
While the 50 Day SMA can be a useful tool for traders and investors, it is important to note that it is a lagging indicator. This means that it is based on past prices and may not accurately predict future price movements. Additionally, the 50 Day SMA can be influenced by short-term volatility or market noise, which can result in false signals. It is always important to use the 50 Day SMA in conjunction with other technical indicators and analysis methods.

Reasons Why Executives are Given Stock Options Stock options are a popular form of compensation for executives in many companies. These options give …
Read Article
Forex Currency in London London, the financial capital of the world, is home to one of the largest foreign exchange markets, known as the forex …
Read Article
Is Forex Trading not gambling? Forex trading, also known as foreign exchange trading, is an activity that involves buying and selling currencies. …
Read Article
Understanding the CFA Swap Rate: A Comprehensive Guide When it comes to trading and investing, understanding the CFA Swap Rate is essential. This …
Read Article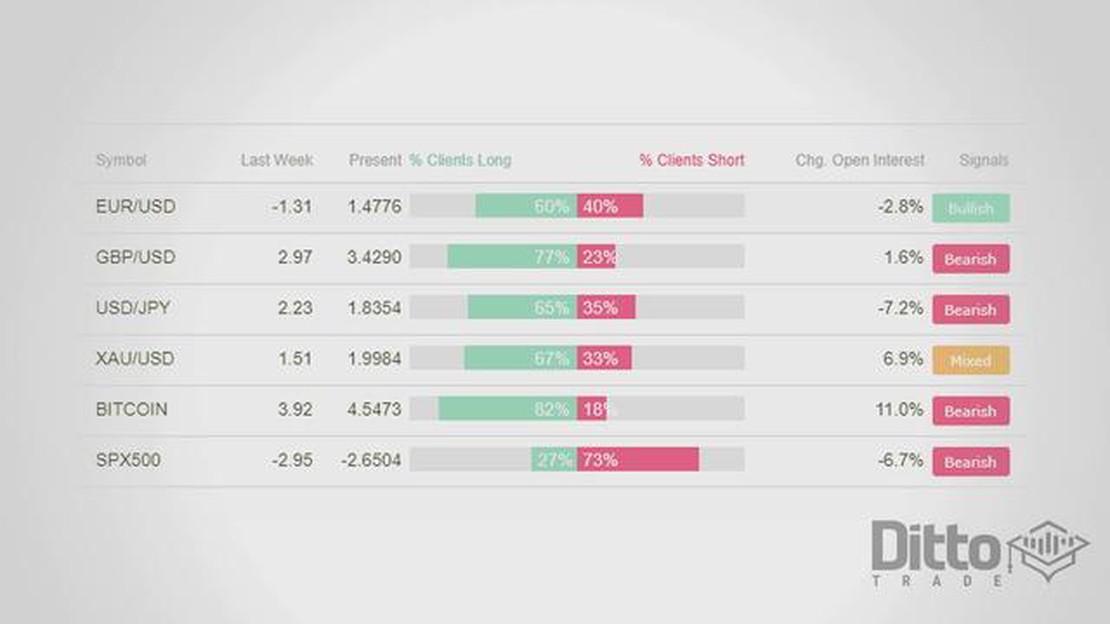
Understanding the Speculative Sentiment Index in Forex Trading Forex trading is a highly volatile and dynamic market where millions of traders around …
Read Article
Is TeleTrade regulated? TeleTrade is a well-known brokerage firm that offers a wide range of financial services. With its long-standing presence in …
Read Article


