

Strategies for Handling Missing Data in Time Series Analysis
How to handle missing data in time series analysis? Missing data is a common issue that can affect the accuracy and reliability of analyses in time …
Read Article
Technical analysis is an essential tool for investors and traders to understand market trends and make informed decisions. One of the key aspects of technical analysis is the use of moving averages, specifically the 50-day moving average (50DMA) and the 200-day moving average (200DMA). These moving averages help identify support and resistance levels, confirm trend reversals, and provide significant insights into market sentiment.
The 50DMA is a short-term moving average that reflects the average price of an asset over the past 50 trading days. This moving average is often used by traders to identify short-term trends and to gauge the momentum of an asset. When the price of an asset crosses above the 50DMA, it is considered a bullish signal, indicating that the asset may continue to rise in the short term. On the other hand, when the price crosses below the 50DMA, it is seen as a bearish signal, suggesting that the asset may decline further.
The 200DMA, on the other hand, is a long-term moving average that represents the average price of an asset over the past 200 trading days. This moving average is widely regarded as a key level of support or resistance. When the price of an asset crosses above the 200DMA, it is considered a strong bullish signal, indicating that the asset may enter a long-term uptrend. Conversely, when the price falls below the 200DMA, it is seen as a significant bearish signal, suggesting that the asset may enter a long-term downtrend.
It is important to note that these moving averages should not be used in isolation, but rather in conjunction with other technical indicators and analysis tools.
By understanding the importance of the 50DMA and 200DMA in technical analysis, investors and traders can gain valuable insights into market trends and make more informed decisions. Integrating these moving averages into their analysis can help them identify potential entry and exit points, manage risk, and improve their overall trading strategies.
Technical analysis is a trading strategy that involves analyzing historical price and volume data to predict future price movements in financial markets. It is based on the belief that historical price patterns and trends can repeat themselves, and that this information can be used to make informed trading decisions.
The main goal of technical analysis is to identify and exploit trends in the market. Traders use various tools and techniques, such as chart patterns, technical indicators, and trend lines, to analyze price and volume data. By identifying trends and patterns, traders aim to predict future price movements and take advantage of potential profit opportunities.
Technical analysis is widely used in trading stocks, commodities, currencies, and other financial instruments. It is especially popular among short-term traders and day traders who aim to profit from short-term price movements. However, it can also be used by long-term investors to identify entry and exit points for their investment positions.

The role of technical analysis in trading is to help traders make informed decisions based on historical price data. By analyzing price patterns and trends, traders can identify potential support and resistance levels, which are areas where buying or selling pressure is expected to be strong. Traders can then use this information to determine when to enter or exit a trade, and to set profit targets and stop-loss orders.
Read Also: Understanding the Long-Term Capital Gain Benefits of an Employee Stock Purchase Plan (ESPP)
While technical analysis is not foolproof and cannot guarantee accurate predictions, it provides traders with a valuable tool to better understand market trends and make informed trading decisions. It is important for traders to combine technical analysis with other forms of analysis, such as fundamental analysis, to get a more comprehensive view of the market and increase their chances of success.
Moving averages are one of the most commonly used and widely recognized indicators in technical analysis. They provide traders and investors with valuable insights into the overall trend and momentum of a security’s price movement.
A moving average is calculated by taking the average price of a security over a specific period of time. This period is often referred to as the “lookback” period. The most commonly used moving averages are the 50-day moving average (50DMA) and the 200-day moving average (200DMA).
The 50DMA is a short-term moving average that provides a snapshot of a security’s recent price movement. It is calculated by averaging the closing prices of the security over the past 50 trading days. This moving average is often considered a key level of support or resistance. If the price of a security is trading above the 50DMA, it indicates that the security is in an uptrend. On the other hand, if the price is trading below the 50DMA, it suggests that the security is in a downtrend.
The 200DMA, on the other hand, is a long-term moving average that provides a broader perspective on a security’s price movement. It is calculated by averaging the closing prices of the security over the past 200 trading days. The 200DMA is often used as a measure of the overall trend of a security. If the price of a security is trading above the 200DMA, it indicates that the security is in a long-term uptrend. Conversely, if the price is trading below the 200DMA, it suggests that the security is in a long-term downtrend.
Traders and investors use moving averages to identify potential buy and sell signals. When the price of a security crosses above its moving average, it is often viewed as a bullish signal, indicating that a trend reversal may be underway. Conversely, when the price crosses below its moving average, it is seen as a bearish signal, suggesting that a downward trend may be forming.
In addition to identifying trends, moving averages can also help traders and investors determine levels of support and resistance. When a security’s price approaches its moving average, it often encounters resistance or support, depending on the direction of the trend. This can be an opportune time to enter or exit a position, as the moving average may act as a barrier to further price movement.
In conclusion, moving averages are a valuable tool in technical analysis. They provide insights into a security’s trend, momentum, and levels of support and resistance. By incorporating moving averages into their trading strategies, traders and investors can make more informed decisions and increase their chances of success in the market.
Read Also: Does Nadex offer a demo account? Find out here
Moving averages help to smooth out price data and identify trends in the market. They are commonly used to determine support and resistance levels, as well as to generate buy and sell signals.

The 50-day moving average is a widely watched indicator that shows the average price of a security over the past 50 trading days. It is used to identify short-term trends and support/resistance levels. When the price of a security crosses above its 50DMA, it is usually considered a bullish signal, while a crossover below the 50DMA is seen as bearish.
The 200-day moving average is a long-term indicator that shows the average price of a security over the past 200 trading days. It is used to identify long-term trends and support/resistance levels. The 200DMA is considered a stronger indicator than the 50DMA and is often used by traders and investors to gauge the overall health of a security or market. Crossovers above or below the 200DMA are seen as significant bullish or bearish signals.
Yes, the 50DMA and 200DMA can be used together to generate trading signals. When the 50DMA crosses above the 200DMA, it is known as a “golden cross” and is considered a bullish signal. Conversely, when the 50DMA crosses below the 200DMA, it is known as a “death cross” and is seen as a bearish signal. Traders often use these crossovers as entry or exit points for trades.
While moving averages are useful indicators, there are some limitations to their effectiveness. For example, moving averages are based on historical data and may not accurately predict future price movements. Additionally, moving averages can be prone to false signals, especially during periods of high volatility. It is important for traders to use moving averages in conjunction with other technical indicators and analysis methods to make more informed trading decisions.
The 50-day moving average (50DMA) and the 200-day moving average (200DMA) are important technical indicators used in analyzing stock market trends. The 50DMA represents the average closing price of a stock over the past 50 trading days, while the 200DMA represents the average closing price over the past 200 trading days. These moving averages help smooth out short-term price fluctuations and provide insights into the overall trend of a stock.
Traders use the 50DMA and 200DMA to identify potential buying or selling opportunities. When the price of a stock crosses above its 50DMA, it could signal the start of an upward trend and a potential buying opportunity. On the other hand, when the price crosses below its 50DMA, it could indicate a downward trend and a potential selling opportunity. The 200DMA is often used as a longer-term trend indicator. When the price is consistently above the 200DMA, it suggests a bullish market, while a price consistently below the 200DMA indicates a bearish market.

How to handle missing data in time series analysis? Missing data is a common issue that can affect the accuracy and reliability of analyses in time …
Read Article
Is Meta Trader 4 on iOS? Meta Trader 4 (MT4) is a popular trading platform that allows traders to access the financial markets and execute trades on …
Read Article
Using Put Options to Hedge Bets Protecting investments is a key concern for investors who want to minimize risk and maximize returns. One strategy …
Read Article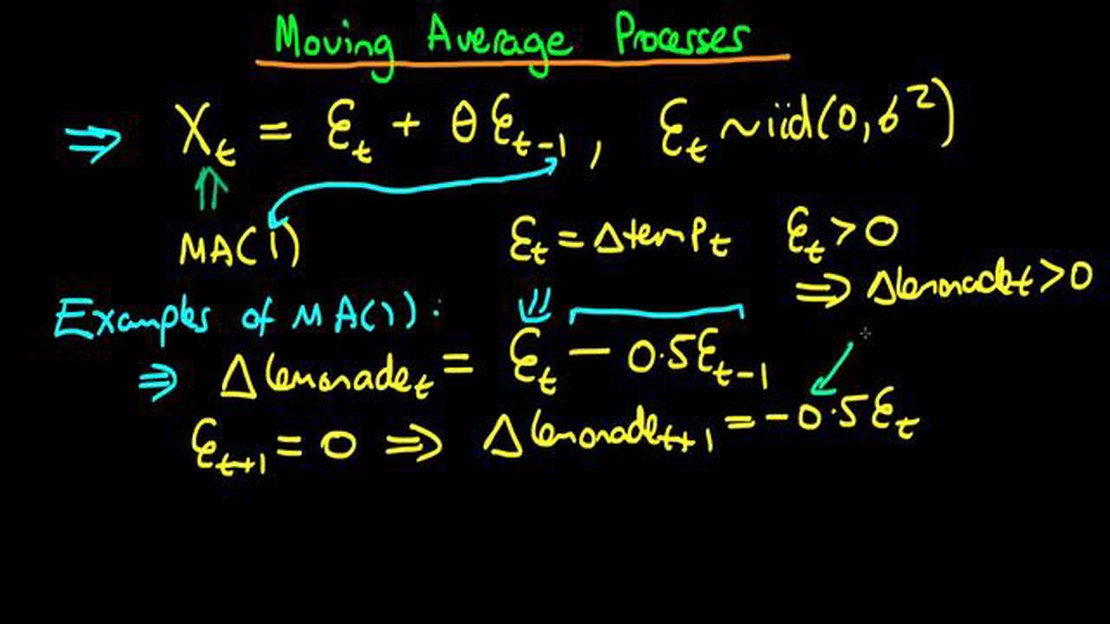
Is Ma 1 stationary? Stationarity is a fundamental concept in time series analysis. It refers to the statistical properties of a process remaining …
Read Article
Can you sell options before market opens? Options are a popular financial instrument used by investors to hedge risk or speculate on the price …
Read Article
Guide on Selling MT4 Indicators: Tips and Strategies Are you an experienced trader who has developed unique and profitable strategies using the …
Read Article


