


Best Ways to Exchange Foreign Currency in NYC | Your Ultimate Guide
Where to Exchange Foreign Currency in NYC Planning a trip to the Big Apple? Whether you’re a tourist visiting New York City or a local planning to …
Read Article
The stock market can be a challenging and unpredictable place for investors. With countless variables at play, understanding and predicting market trends can seem like an impossible task. However, one concept that has gained popularity among traders and analysts is the Hurst exponent.
The Hurst exponent is a mathematical tool that measures the long-term persistence of a time series, such as stock prices. It was developed by Harold Edwin Hurst in the 1950s and has since been used to analyze various phenomena, including financial markets. Understanding the Hurst exponent can provide crucial insights into the behavior and trends of the stock market.
The Hurst exponent ranges from 0 to 1, with values closer to 0 indicating mean reversion and values closer to 1 indicating long-term trendiness. By calculating the Hurst exponent for a given time series, investors can gain valuable information about whether the market is exhibiting random, unpredictable behavior or if there are underlying trends that can be exploited.
In this comprehensive guide, we will delve into the intricacies of the Hurst exponent and its application in the stock market. We will explore how the Hurst exponent is calculated, what it signifies, and how it can be used to inform investment strategies. Whether you are a seasoned investor or just starting out, understanding the Hurst exponent can be a powerful tool in navigating the complexities of the stock market.
The Hurst exponent, named after Harold Edwin Hurst, is a measure of long-term memory in time series data. It is commonly used in financial analysis to determine the predictability and persistence of stock market trends.
The Hurst exponent quantifies the fractal nature of a time series, indicating whether it is trending, mean-reverting, or exhibiting random behavior. It is calculated using the rescaled range analysis, which involves dividing the time series into different time periods and measuring the ratio of the range to the standard deviation.
A Hurst exponent value between 0 and 0.5 indicates mean-reverting behavior, suggesting that the stock market is likely to revert to its mean value. A value between 0.5 and 1 indicates trending behavior, indicating that past trends are likely to continue in the future. A value of 0.5 suggests a completely random or unpredictable market.

Understanding the Hurst exponent can help investors and traders make better decisions based on the current and expected future behavior of the stock market. It can be helpful in identifying potential trends, predicting reversals, and determining the optimal time to enter or exit a position.
However, it is important to note that the Hurst exponent is not a guaranteed predictor of future market behavior, and should be used in conjunction with other technical indicators and fundamental analysis.
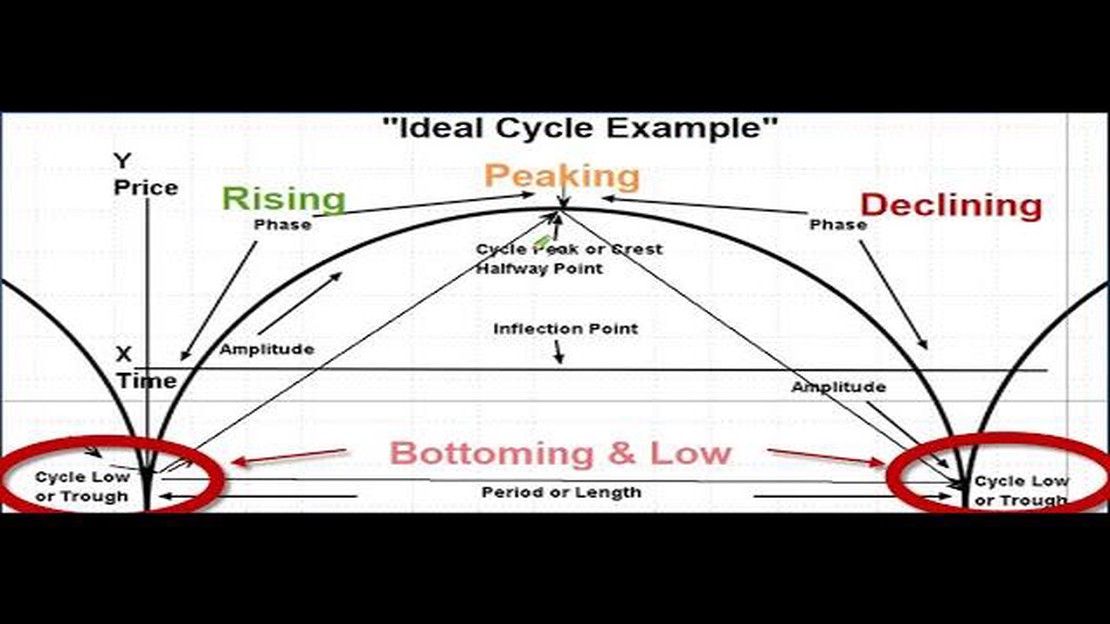
The Hurst exponent is a key component in understanding the dynamics of the stock market. It provides insights into the underlying structure and predictability of stock price movements. By analyzing the Hurst exponent, traders and investors can gain a better understanding of market trends and make more informed decisions.
Read Also: Learn the Basics of Puts and Options | The Ultimate Guide
One of the main reasons why understanding the Hurst exponent is important is its ability to measure the long-term memory of stock price data. The Hurst exponent can indicate whether a stock is more likely to exhibit a trend or revert to its mean. A high Hurst exponent suggests that the stock price is more likely to experience persistent trends, while a low Hurst exponent indicates that the stock price is more likely to exhibit mean-reverting behavior.
Furthermore, the Hurst exponent can be used to identify periods of market inefficiency. It is well-known that the stock market alternates between trending and non-trending phases. By analyzing the Hurst exponent, traders can identify when the market is in a trending phase and take advantage of the opportunities presented. Additionally, by understanding the Hurst exponent, traders can also determine when the market is in a non-trending phase and avoid making trades that are likely to result in losses.
Another reason why understanding the Hurst exponent is important is its potential application in portfolio management. By using the Hurst exponent, investors can assess the diversification benefits of including certain stocks in their portfolios. Stocks with low Hurst exponents may provide diversification benefits as they are less likely to move in tandem with the broader market. Conversely, stocks with high Hurst exponents may not provide significant diversification benefits as they are more likely to move in the same direction as the broader market.
In conclusion, understanding the Hurst exponent is crucial for anyone involved in the stock market. It provides valuable insights into the structure and predictability of stock price movements, helps identify market inefficiencies, and can be used in portfolio management. By incorporating the Hurst exponent into their analysis, traders and investors can enhance their decision-making process and potentially improve their overall performance in the stock market.
Read Also: Is Avanade a Good Company to Work For? Pros and Cons of Working at Avanade
Understanding and analyzing the Hurst in the stock market can be a valuable tool for traders and investors. By studying the Hurst exponent, a measure of long-term memory in market data, traders can gain insights into stock price movements and potential trends.
Here are the steps to analyze the Hurst in the stock market:
It is important to note that the Hurst exponent is not a guarantee of future market movements. It is a statistical measure that provides insights into the underlying dynamics of a market. Traders and investors should use it as one tool among many to make well-informed trading decisions.

In conclusion, analyzing the Hurst exponent in the stock market can help traders identify potential trends and make informed trading decisions. By understanding the long-term memory in market data, traders can gain valuable insights into stock price movements and market dynamics.
The Hurst exponent is a measure of the long-term memory of a time series. It quantifies the strength of the trend and helps identify whether the series is trending or mean-reverting.
The Hurst exponent is typically calculated using the rescaled range analysis, also known as the R/S analysis. It involves dividing the time series into different sub-series, calculating the range for each sub-series, and then taking the average of the ratio of the range to the standard deviation. This ratio is then raised to the power of the Hurst exponent, which is estimated through regression analysis.
A Hurst exponent value of 0.5 indicates that the time series is characterized by a random walk, where future values are completely independent of past values. It suggests that there is no long-term memory or trend in the series.
The Hurst exponent can be used in stock market analysis to identify trending or mean-reverting behavior in stock price movements. If the Hurst exponent is greater than 0.5, it suggests the presence of a trend and the potential for future price movements to continue in the same direction. If the Hurst exponent is less than 0.5, it indicates mean-reverting behavior and the likelihood of future price movements reversing direction.

Where to Exchange Foreign Currency in NYC Planning a trip to the Big Apple? Whether you’re a tourist visiting New York City or a local planning to …
Read Article
Understanding the Difference Between ECN and Exchange In the world of finance, Electronic Communication Networks (ECNs) and traditional exchanges are …
Read Article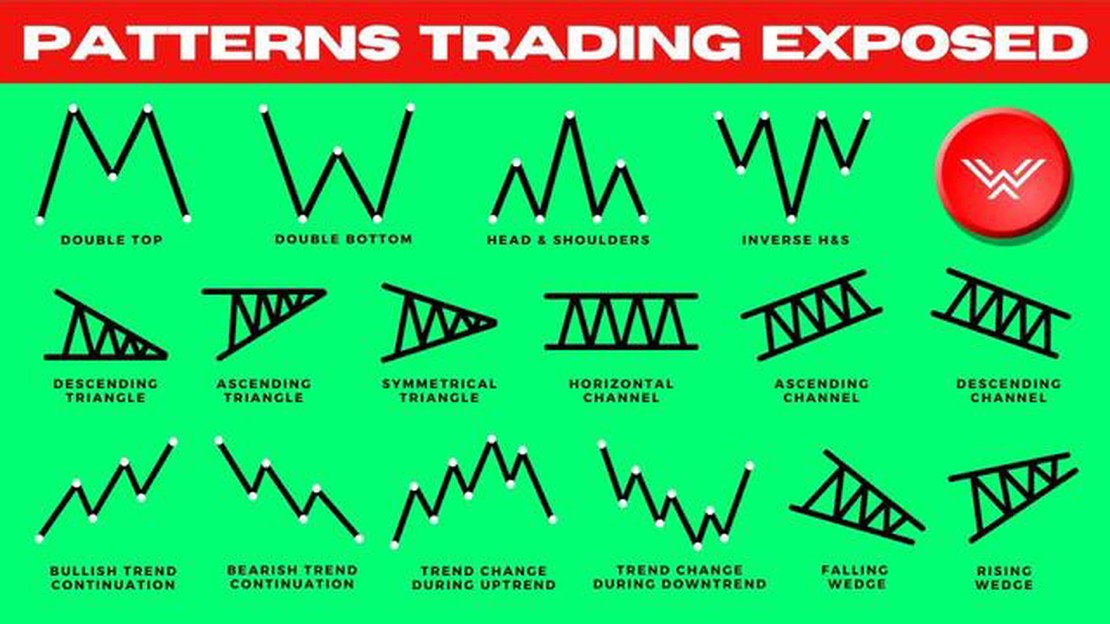
Identifying Trading Patterns: A Comprehensive Guide In the world of financial markets, trading patterns play a crucial role in determining the future …
Read Article
What is the spread of a forex broker? When it comes to forex trading, understanding the concept of spread is crucial. Spread is the difference between …
Read Article
Reasons to Invest in Binary Options Binary options trading has gained immense popularity in recent years. It is a financial investment option that …
Read Article
Nedbank International Transfer Fees: How Much Does it Cost? When it comes to transferring money internationally, it’s essential to be aware of the …
Read Article


