

How Much Is 1.0 in Forex? Understanding Currency Exchange Rates
1.0 forex rate: How much is it? In the world of forex trading, one of the most important concepts to grasp is the exchange rate. The exchange rate …
Read Article
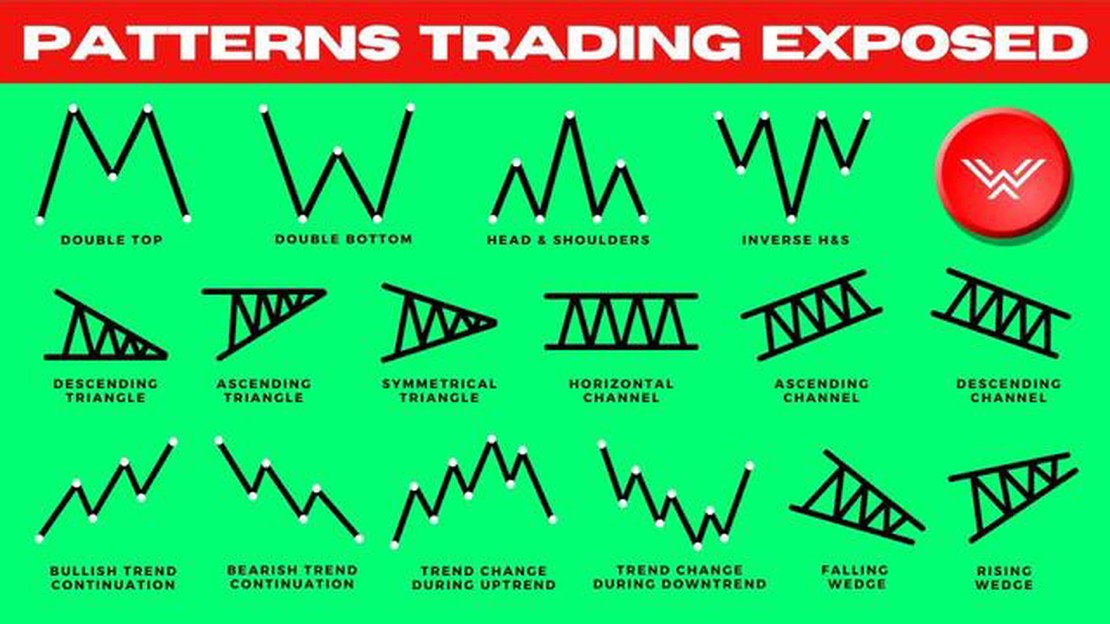
In the world of financial markets, trading patterns play a crucial role in determining the future direction of an asset’s price. Whether you are a beginner or an experienced trader, understanding and recognizing these patterns can greatly enhance your trading skills and increase your chances of making profitable trades.
Trading patterns are repetitive formations that appear on price charts and provide valuable insights into market sentiment and future price movements. By identifying these patterns, traders can anticipate potential price reversals, breakouts, or continuations, allowing them to enter or exit trades at opportune moments.
One of the most common trading patterns is the “head and shoulders” pattern. It consists of three peaks, with the middle peak (the head) being higher than the other two (the shoulders). This pattern typically indicates a trend reversal from bullish to bearish and can be identified by drawing trendlines connecting the peaks and neckline.
Another popular trading pattern is the “double bottom” pattern. As the name suggests, it consists of two lows at near the same level, separated by a high point. This pattern signifies a potential bullish reversal and can be identified by connecting the lows and drawing a resistance line at the high point. Traders often enter long positions when the price breaks above this resistance line.
These are just a couple of examples of trading patterns that traders use to make informed trading decisions. To become proficient in recognizing trading patterns, it is essential to study and practice analyzing different chart patterns and their corresponding signals. By doing so, you can develop a systematic approach to trading and increase your chances of success in the financial markets.
Before diving into trading patterns, it is important to have a basic understanding of the fundamentals of trading. Here are some key concepts to grasp:
These concepts lay the foundation for understanding trading patterns and can help beginner traders recognize and interpret patterns more effectively.
When it comes to trading patterns, there are several common ones that traders often look for. These patterns can provide valuable insights into future price movements and help traders make informed decisions.
1. Head and Shoulders

The head and shoulders pattern is a reversal pattern that often indicates a trend reversal from bullish to bearish. It consists of a peak (the head) with two smaller peaks on either side (the shoulders). This pattern is considered a bearish signal and may suggest that it’s a good time to sell.
2. Double Top/Bottom
The double top pattern is a bearish reversal pattern, while the double bottom pattern is a bullish reversal pattern. Both patterns consist of two peaks or valleys, with a trough or peak in between. Traders often consider these patterns as indications that a trend may be coming to an end and look for opportunities to enter or exit positions accordingly.
3. Triangle
A triangle pattern is formed when the price range narrows over time, forming converging trend lines. There are three types of triangles: ascending, descending, and symmetrical. Traders often wait for a breakout from the triangle pattern to the upside or downside to confirm a trend continuation or reversal.
4. Cup and Handle
Read Also: Does BDO have international branches? Find out everything you need to know in this comprehensive guide.
The cup and handle pattern is a bullish continuation pattern often seen in longer-term charts. It is formed when the price initially forms a rounded bottom (the cup) and then consolidates briefly before continuing in an upward direction (the handle). Traders often interpret this pattern as a sign that the price is likely to continue its upward movement.
5. Pennant
Read Also: Does TradingView Offer Options Trading? Find Out Here!
A pennant pattern is similar to a triangle pattern but typically occurs during a shorter time frame. It is characterized by converging trend lines and is often seen as a temporary pause in the price movement before the trend continues. Traders often look for a breakout from the pennant to confirm a trend continuation.
These are just a few of the common trading patterns that traders use to guide their decision-making process. It’s important to note that patterns alone should not be the sole basis for trading decisions, and it’s essential to use other technical indicators and analysis to confirm any signals provided by these patterns.
Recognizing and understanding trading patterns can be an essential tool for making informed trading decisions. By studying historical price and volume data, traders can identify recurring patterns that may indicate future market movements.
One common pattern that traders often look for is the “head and shoulders” pattern. This pattern typically appears after an uptrend and is characterized by three distinct peaks, with the middle peak being higher than the other two. The pattern suggests that the market may be nearing a reversal, and traders may look to enter a short position.
Another frequently observed pattern is the “double bottom” pattern. This pattern occurs after a downtrend and is characterized by two distinct troughs, with the second trough being higher than the first. The pattern indicates that the market may be starting to reverse, and traders may consider entering a long position.
The “flag” pattern is yet another commonly recognized pattern. This pattern appears as a small rectangular shape that resembles a flagpole, followed by a parallel channel that represents a consolidation period. Once the price breaks out of this consolidation phase, traders may anticipate a continuation of the previous trend and may act accordingly.

It is important to note that these patterns are not foolproof indicators of market movements. Traders should always use additional analysis and consider other factors, such as market trends, support and resistance levels, and fundamental analysis, to make informed trading decisions.
By studying and recognizing these and other trading patterns, traders can gain valuable insights into market dynamics and potentially improve their trading strategies. However, it is essential to remember that patterns should be used as a tool in conjunction with other analysis methods, rather than as standalone indicators.
Trading patterns are repetitive formations in price charts that indicate potential market reversals or continuations.
Recognizing trading patterns can help you make more informed trading decisions and increase your chances of profitability.
Some common trading patterns include head and shoulders, double tops and double bottoms, triangles, and wedges.
You can recognize trading patterns by studying price charts, analyzing the shape and formation of price movements, and using technical indicators.
Trading patterns can be reliable indicators, but they should be used in conjunction with other forms of analysis and risk management strategies.

1.0 forex rate: How much is it? In the world of forex trading, one of the most important concepts to grasp is the exchange rate. The exchange rate …
Read Article
Does XM offer fixed spreads? Fixed spreads are an important factor to consider when choosing a forex broker. They determine the cost of trading and …
Read Article
Types of Clearing in Financial Markets Clearing is an essential process in various industries, including finance, telecommunications, and logistics. …
Read Article
Best Stock Tracking Apps to Keep You Informed Tracking and monitoring the stock market is crucial for any investor or trader. With the fast-paced …
Read Article
Is Copy Trading Available on FX Pro? FX Pro is one of the leading online forex brokers in the industry, known for its innovative trading technologies …
Read Article
Exercising Options After IPO: Everything You Need to Know Introduction: Initial Public Offering (IPO) is an exciting time for a company and its …
Read Article


