


Is Options Easier Than Forex? Exploring the Differences and Benefits
Are Options Easier Than Forex? Options and forex are both popular forms of trading in the financial market, but they differ in many ways. Many traders …
Read Article
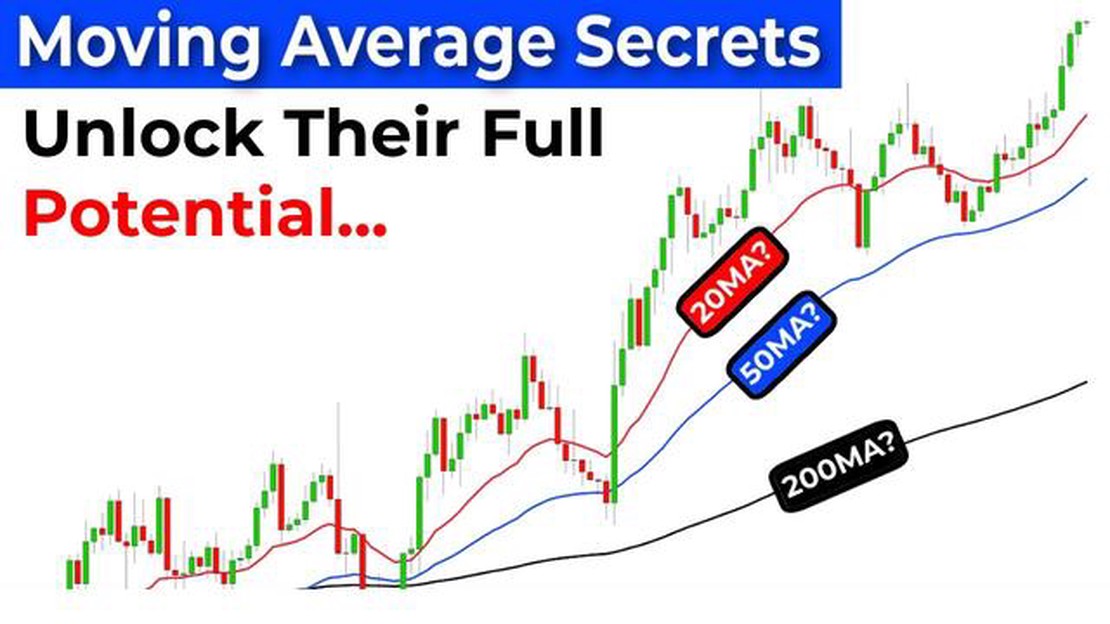
When it comes to technical analysis in trading, moving averages play a crucial role in identifying trends and potential entry and exit points. Traders often use different types of moving averages to smooth out price data and gain a clearer understanding of the underlying trend.
One important concept to understand when using moving averages is the concept of the “gap” between different moving averages. The gap refers to the distance or difference between two or more moving averages plotted on a price chart. These moving averages are typically calculated over different periods, such as 50-day and 200-day moving averages.
By analyzing the gap between moving averages, traders can gain insights into the strength and direction of a market trend. A large gap between moving averages indicates a strong trend, while a narrow or converging gap suggests a potential trend reversal or consolidation. Traders can use this information to make more informed trading decisions and adjust their strategies accordingly.
There are different ways to utilize the gap between moving averages in trading. Some traders use it as a confirmation tool, waiting for the moving averages to cross or for the gap to widen before entering or exiting a trade. Others may look for divergences between price and the gap, which can signal potential reversals or continuation patterns.
Overall, understanding and monitoring the gap between moving averages can provide valuable insights into market trends and improve trading decisions. By incorporating this concept into your technical analysis toolkit, you can enhance your ability to identify profitable trading opportunities and manage risk effectively.
The gap between moving averages refers to the difference between two different moving averages used in technical analysis. Moving averages are commonly used to smooth out price fluctuations and identify trends in financial markets. By calculating the average price over a specific time period, these indicators provide insights into the overall direction of an asset’s price movement.
When two moving averages with different time periods are plotted on a chart, the gap between them can provide valuable information to traders. This gap represents the divergence between the short-term trend and the long-term trend. By analyzing the size and direction of the gap, traders can gain insights into the strength and sustainability of a trend.

For example, a widening gap between a shorter-term moving average and a longer-term moving average suggests increasing momentum in the market. This could indicate a strong and sustainable trend, presenting an opportunity for traders to enter or stay in a position. Conversely, a narrowing gap may suggest weakening momentum and a potential trend reversal.
By understanding the gap between moving averages, traders can make better-informed decisions when executing trades. They can use this information to confirm or validate their existing trading strategies or to identify new trading opportunities. Additionally, monitoring the gap between moving averages can help traders manage risk and establish proper stop-loss levels.
It is important to note that the interpretation of the gap between moving averages may vary depending on the specific trading strategy and market conditions. Traders should always consider multiple indicators and employ risk management techniques when making trading decisions.
Read Also: Is Divergence a Profitable Strategy? Exploring the Pros and Cons
In conclusion, understanding the gap between moving averages can provide valuable insights into the strength and sustainability of market trends. By analyzing the size and direction of this gap, traders can make better trading decisions, confirm existing strategies, and identify new opportunities for profit.
Understanding and analyzing moving averages is crucial for making informed trading decisions. Moving averages are one of the most widely used technical indicators in the financial markets, helping traders identify trends, determine support and resistance levels, and generate buy or sell signals.
One of the key benefits of analyzing moving averages is the ability to identify trends. By calculating the average price over a specific period, moving averages smooth out price fluctuations and provide a clearer picture of the overall trend. Traders can then use this information to make better decisions about entering or exiting positions.
Moving averages are also valuable for determining support and resistance levels. When an asset’s price is moving above its moving average, the moving average can act as a support level, indicating that the price is likely to continue its upward trend. Conversely, when the price is moving below the moving average, it can act as a resistance level, suggesting that the price is more likely to decline.
Read Also: How to Evaluate the Value of Stock Options
In addition to identifying trends and support/resistance levels, moving averages can be used to generate buy or sell signals. One common strategy is to look for a crossover between two moving averages, such as the 50-day and 200-day moving averages. When the shorter-term moving average crosses above the longer-term moving average, it can signal a buy opportunity. Conversely, when the shorter-term moving average crosses below the longer-term moving average, it can signal a sell opportunity.
Overall, analyzing moving averages provides traders with valuable insights into market trends, support/resistance levels, and potential buy or sell signals. By incorporating moving averages into their trading strategies, traders can make more informed and profitable trading decisions.
A moving average is a technical analysis tool that helps identify trends and potential reversals in financial markets. It is calculated by averaging a certain number of past price points, which smooths out price fluctuations and provides a clearer view of the overall trend.

The gap between moving averages refers to the difference between two different moving averages, such as the 50-day moving average and the 200-day moving average. This gap can provide insights into the strength of a trend and potential trading opportunities.
The gap between moving averages can be used as a signal for potential trend reversals or the continuation of a trend. Traders often look for crossovers, where a shorter-term moving average crosses above or below a longer-term moving average, as a buy or sell signal. Additionally, the size of the gap can indicate the strength of the trend.
Yes, the 50-day moving average and the 200-day moving average are commonly used moving averages for analyzing the gap between them. The 50-day moving average provides a shorter-term trend perspective, while the 200-day moving average gives a longer-term trend perspective. Traders often watch for crossovers between these two moving averages.
Yes, the gap between moving averages can be used for all financial markets, including stocks, commodities, and currencies. It is a widely used technical analysis tool that helps traders identify trends and potential trading opportunities in any market. However, it’s important to note that different markets may require different parameters for the moving averages, as volatility and trends can vary.
The gap between moving averages refers to the difference between two or more moving averages on a price chart. It can be calculated by subtracting one moving average from another.
Understanding the gap between moving averages can help in trading decisions by providing insights into the strength of a trend. A larger gap indicates a stronger trend, while a smaller or narrowing gap may suggest a weakening trend or a potential reversal. Traders can use this information to make informed decisions on entry or exit points.

Are Options Easier Than Forex? Options and forex are both popular forms of trading in the financial market, but they differ in many ways. Many traders …
Read Article
Benefits of Using Autoregressive Models Autoregressive models, commonly referred to as AR models, are a powerful tool in data analysis. These models …
Read Article
Get Real Crypto for Free: The Ultimate Guide Are you interested in earning cryptocurrencies without investing any money? With the rise of blockchain …
Read Article
Investing in S&P: A Comprehensive Guide Welcome to our comprehensive guide on investing in the S&P 500! If you want to take advantage of the stability …
Read Article
Understanding Non-Qualified Stock Options Non-qualified stock options (NQSOs) are a popular form of compensation provided by companies to their …
Read Article
How to effectively use RSI and Bollinger Bands for trading The Relative Strength Index (RSI) and Bollinger Bands are two popular technical analysis …
Read Article


