


Top indicators for successful binary options trading
Best Indicators for Binary Options Trading Binary options trading is a popular way to make money online, but it can also be a risky endeavor. One of …
Read Article
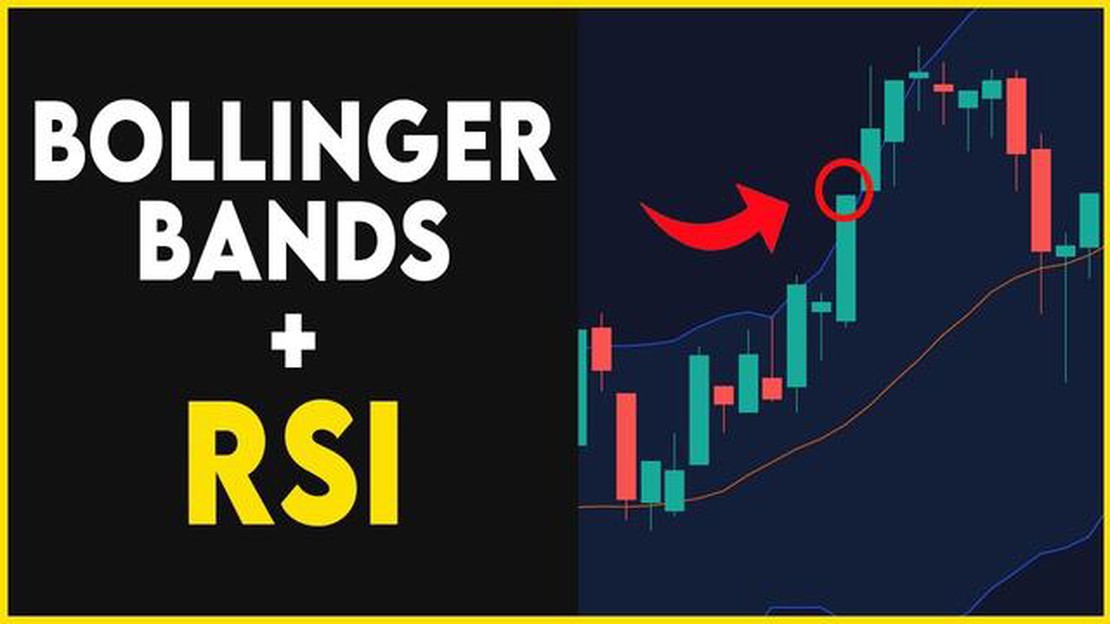
The Relative Strength Index (RSI) and Bollinger Bands are two popular technical analysis tools used by traders to analyze price movements and identify potential trading opportunities. These indicators provide valuable information about market trends, volatility, and overbought or oversold conditions.
The RSI is a momentum oscillator that measures the speed and change of price movements. It is often used to identify overbought and oversold conditions in the market. Traders consider a stock or asset to be overbought when the RSI is above 70 and oversold when it is below 30. The RSI can help traders determine when a security is due for a reversal or a correction.
Bollinger Bands, on the other hand, are a volatility indicator that consists of a moving average line and two standard deviation lines. The upper and lower bands represent the volatility of the price, with the bands expanding during periods of high volatility and contracting during periods of low volatility. Traders use Bollinger Bands to identify potential entry and exit points based on the width of the bands and the location of the price relative to the bands.
By combining the RSI and Bollinger Bands, traders can gain a more comprehensive understanding of the market conditions and make more informed trading decisions. The RSI can help confirm or filter signals generated by Bollinger Bands, and vice versa. Traders can use these indicators to identify potential trend reversals, confirm the strength of a trend, and generate buy or sell signals.
However, it is important to note that no indicator is foolproof and should not be used in isolation. Traders should always consider other factors, such as fundamental analysis and market sentiment, before making trading decisions. Additionally, it is recommended to backtest and validate any trading strategy using these indicators before applying it in real-time trading. With proper understanding and careful analysis, the RSI and Bollinger Bands can be powerful tools in a trader’s toolbox.
The Relative Strength Index (RSI) is a popular technical analysis indicator used by traders to measure the strength and momentum of a price trend. It was developed by J. Welles Wilder Jr. in 1978, and it has since become one of the most widely used indicators in the trading community.
The RSI is based on the concept of momentum, which refers to the speed at which prices are changing. It is a bounded oscillator that fluctuates between 0 and 100, and it can provide valuable insights into market conditions.
The RSI indicator is calculated using a formula that takes into account the average gains and losses over a specified period of time. The formula is as follows:
RSI = 100 - (100 / (1 + RS))
where RS is the average of the up periods divided by the average of the down periods over the specified time period.
Traders use the RSI indicator to identify overbought and oversold conditions in a market. When the RSI value exceeds 70, it is considered overbought, suggesting that the price may be due for a correction or reversal. Conversely, when the RSI value drops below 30, it is considered oversold, indicating that the price may be due for a bounce or rally.
In addition to identifying overbought and oversold conditions, the RSI indicator can also be used to spot bullish and bearish divergences, which can provide early indications of a trend reversal. A bullish divergence occurs when the RSI makes a higher low while the price makes a lower low, suggesting that the momentum is shifting to the upside. Conversely, a bearish divergence occurs when the RSI makes a lower high while the price makes a higher high, indicating that the momentum is shifting to the downside.

By understanding and utilizing the RSI indicator, traders can enhance their trading strategies and make more informed decisions. Whether used in conjunction with other indicators or as a standalone tool, the RSI can provide valuable insights into market conditions and help traders identify potential entry and exit points.
Bollinger Bands are a popular technical analysis tool that can be used to identify market volatility and potential trend reversals. They consist of a simple moving average (SMA) in the middle, with an upper band and a lower band that are a certain number of standard deviations away from the SMA.
Read Also: Which countries participate in the SWIFT banking system?
When the market is more volatile, the distance between the upper and lower bands widens, indicating a higher level of uncertainty and potential for larger price moves. Conversely, when the market is less volatile, the bands contract, signaling a period of consolidation or low volatility.
One way to use Bollinger Bands is to look for price to touch or break through the upper or lower band, as this can signify a potential trend reversal. For example, if prices are consistently touching or breaking through the upper band, it may signal an overbought condition and a potential reversal to the downside. Similarly, if prices are touching or breaking through the lower band, it may indicate an oversold condition and a potential reversal to the upside.
Traders can also look for confirmation of a trend reversal by using other technical indicators, such as the relative strength index (RSI), to identify overbought or oversold conditions. If the RSI is in overbought territory and prices touch or break through the upper band, it may provide a stronger signal for a potential trend reversal to the downside.
It’s important to note that Bollinger Bands are not foolproof and should be used in conjunction with other technical analysis tools and indicators. They are best used as a guide to help identify potential market volatility and trend reversals, but traders should always consider other factors, such as fundamental analysis and market sentiment, before making trading decisions.
Overall, Bollinger Bands can be a valuable tool for traders to identify market volatility and potential trend reversals. By understanding how the bands react to changes in market conditions and using them in conjunction with other technical analysis tools, traders can gain a better understanding of market dynamics and make more informed trading decisions.
The Relative Strength Index (RSI) and Bollinger Bands are popular technical indicators used by traders to analyze market trends and make trading decisions. While each indicator has its own merits, combining the two can provide more accurate trading signals.
Read Also: Learn the Basics of Trading US Index Options: A Step-by-Step Guide
The RSI is a momentum oscillator that measures the speed and change of price movements. It oscillates between 0 and 100, with values above 70 indicating overbought conditions and values below 30 indicating oversold conditions. Traders often use the RSI to identify potential trend reversals.
The Bollinger Bands, on the other hand, are volatility bands placed above and below the moving average. They provide a visual representation of the market’s volatility and can help identify overbought and oversold conditions. When the price touches the upper band, it is considered overbought, and when it touches the lower band, it is considered oversold.

By combining the RSI and Bollinger Bands, traders can get a more comprehensive view of the market and generate more accurate trading signals. One common approach is to use the RSI as a confirmation tool for Bollinger Band signals. For example, if the price touches the upper Bollinger Band and the RSI is above 70, it could be a stronger signal to sell.
Another approach is to use the RSI to identify divergence from the Bollinger Bands. Divergence occurs when the price makes a new high or low, but the RSI fails to confirm the move. This can indicate a potential trend reversal or weakening of the current trend.
It is important to note that while combining the RSI and Bollinger Bands can provide more accurate trading signals, it is still essential to consider other factors and use proper risk management techniques. Traders should also be aware that no indicator or combination of indicators can guarantee profits in the market.
In conclusion, by combining the RSI and Bollinger Bands, traders can enhance their analysis and generate more accurate trading signals. Whether used as a confirmation tool or to identify divergence, these indicators can provide valuable insights into market trends and help traders make more informed trading decisions.
RSI stands for Relative Strength Index. It is a popular technical indicator used in trading to analyze the strength and weakness of a financial instrument. Traders use RSI to identify overbought and oversold conditions, as well as to confirm the trend and possible trend reversals.
Yes, RSI can be used in any type of market, including stocks, commodities, forex, and cryptocurrencies. It is a versatile indicator that helps traders analyze the price movements and make informed trading decisions.
Bollinger Bands are a technical analysis tool that consists of a center line and two price channels. The center line is usually a simple moving average, while the price channels are calculated based on the volatility of the price. Bollinger Bands help traders identify volatility, overbought and oversold conditions, as well as potential trend reversals.
Yes, RSI and Bollinger Bands can be used together to enhance trading signals. When RSI indicates overbought or oversold conditions, traders can look for signals from Bollinger Bands to confirm the potential trend reversals. These two indicators complement each other and provide a more comprehensive analysis of the market.
RSI and Bollinger Bands are commonly used by both beginner and experienced traders. However, it is important for beginners to understand the concepts and learn how to interpret the signals correctly. It is recommended to practice using these indicators on a demo account and gain experience before applying them in real trading.
RSI stands for Relative Strength Index. It is a momentum oscillator that measures the speed and change of price movements. It ranges from 0 to 100 and is used to identify overbought and oversold levels of a security.

Best Indicators for Binary Options Trading Binary options trading is a popular way to make money online, but it can also be a risky endeavor. One of …
Read Article
Understanding CMTA in Options Trading In options trading, the Clearing Member Trade Assignment (CMTA) process plays a crucial role in ensuring the …
Read Article
Top Trading Software in Australia When it comes to trading in the Australian market, having the right trading software is essential. The right …
Read Article
What are the pros and cons of scalping? Scalping is a popular trading strategy in the financial markets, especially in the forex and stock markets. It …
Read Article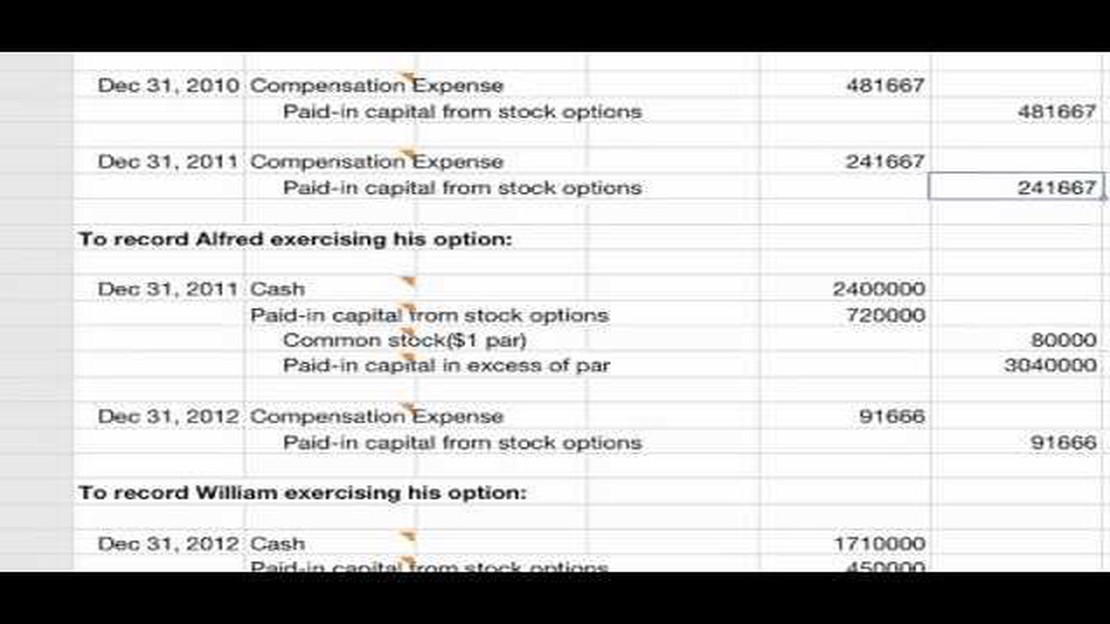
Recording Stock Options in Accounting: A Comprehensive Guide Stock options play a significant role in the world of accounting and finance. They are a …
Read Article
Is IQ Options Legit? The Truth Behind the Popular Trading Platform IQ Options is a popular online trading platform that has gained significant …
Read Article


