The VIX, also known as the Volatility Index, is a widely watched measure of market volatility. Traders and investors often use this index to gauge market sentiment and assess potential risks. One commonly used tool in analyzing the VIX is the 50-day moving average, which provides insights into the overall trend and direction of volatility.
Table Of Contents
The 50-day moving average is calculated by taking the average closing prices of the VIX over the past 50 trading days. This moving average smooths out the daily fluctuations, allowing traders to identify long-term trends. By comparing the current VIX level to its 50-day moving average, traders can gain insights into whether volatility is increasing or decreasing.
When the VIX is above its 50-day moving average, it indicates that volatility is higher than its recent average. This suggests that market sentiment is more uncertain and that there may be increased potential for significant price swings. On the other hand, when the VIX is below its 50-day moving average, it suggests that volatility is lower than its recent average, indicating more stable market conditions.
By analyzing the relationship between the VIX and its 50-day moving average, traders can make more informed decisions about their trading strategies. They can use this information to adjust their risk tolerance, determine when to enter or exit trades, and identify potential opportunities for profit. Understanding the 50-day moving average of the VIX is an essential component of successful volatility trading.
In summary, the 50-day moving average of the VIX is a valuable tool for traders and investors. It provides insights into the overall trend and direction of market volatility. By comparing the current VIX level to its 50-day moving average, traders can assess the level of uncertainty and potential risks in the market. Incorporating this analysis into trading strategies can lead to more informed decisions and improved profitability. So, understanding the 50-day moving average of the VIX is crucial for anyone involved in volatility trading.
What is the 50-day moving average of the VIX?
The 50-day moving average of the VIX is a technical indicator that is used to analyze the volatility of the stock market. The VIX, also known as the CBOE Volatility Index, is a popular measure of market volatility. It is often referred to as the “fear index” because it tends to rise when investors are becoming more fearful or uncertain about the future direction of the market.
The 50-day moving average is calculated by taking the average closing prices of the VIX over the past 50 trading days. This helps to smooth out the day-to-day price fluctuations and provides a more long-term view of the VIX’s volatility. Traders and investors use the 50-day moving average as a trend-following indicator, with the belief that when the VIX is trading above its 50-day moving average, it indicates a higher level of market volatility, and when the VIX is trading below its 50-day moving average, it indicates a lower level of volatility.
Pros
Cons
Helps to identify periods of high market volatility
May produce delayed signals
Provides a more smoothed and less noisy view of the VIX’s volatility
Does not provide information on the direction of the market
Easy to calculate and interpret
May generate false signals in volatile markets
Overall, the 50-day moving average of the VIX is a useful tool for traders and investors to gauge the overall volatility of the stock market. It can help them make more informed decisions about when to enter or exit positions and manage their risk exposure. However, it is important to note that no indicator is perfect, and the 50-day moving average should be used in conjunction with other technical indicators and fundamental analysis to make well-rounded trading and investment decisions.
Exploring the concept and its significance in stock market analysis
The 50-day moving average of the VIX is a key concept in stock market analysis. It is a technical indicator that is used to measure the volatility and sentiment of the stock market. The VIX, also known as the CBOE Volatility Index, tracks the implied volatility of options on the S&P 500 index.
The 50-day moving average is calculated by taking the average value of the VIX over the past 50 trading days. This moving average provides a smoothed line that reflects the longer-term trend of the VIX. It helps to filter out short-term fluctuations and provide a clearer picture of the overall market sentiment.
By analyzing the 50-day moving average of the VIX, traders and investors can gain insights into the market’s perception of risk and volatility. When the VIX is above its 50-day moving average, it indicates that there is higher uncertainty and fear in the market. This could be due to economic or geopolitical factors that are causing market participants to seek protection in options and drive up the implied volatility.
On the other hand, when the VIX is below its 50-day moving average, it suggests that the market is relatively calm and complacent. This could be a sign of stability and confidence among investors, indicating a lower level of fear and uncertainty. However, it’s important to note that low volatility doesn’t necessarily mean that the market is in a bullish phase. It could also indicate a lack of interest or complacency among market participants.
Traders and investors often use the 50-day moving average of the VIX as a reference point when making trading decisions. If the VIX crosses above its 50-day moving average, it could be a signal to increase caution and adjust positions accordingly. Conversely, if the VIX crosses below its 50-day moving average, it could be a signal to become more optimistic and consider taking on more risk.
Overall, understanding the 50-day moving average of the VIX is essential for stock market analysis. It provides valuable insights into market sentiment, risk perception, and potential trading opportunities. By incorporating this concept into their analysis, traders and investors can make more informed decisions and navigate the market with greater confidence.
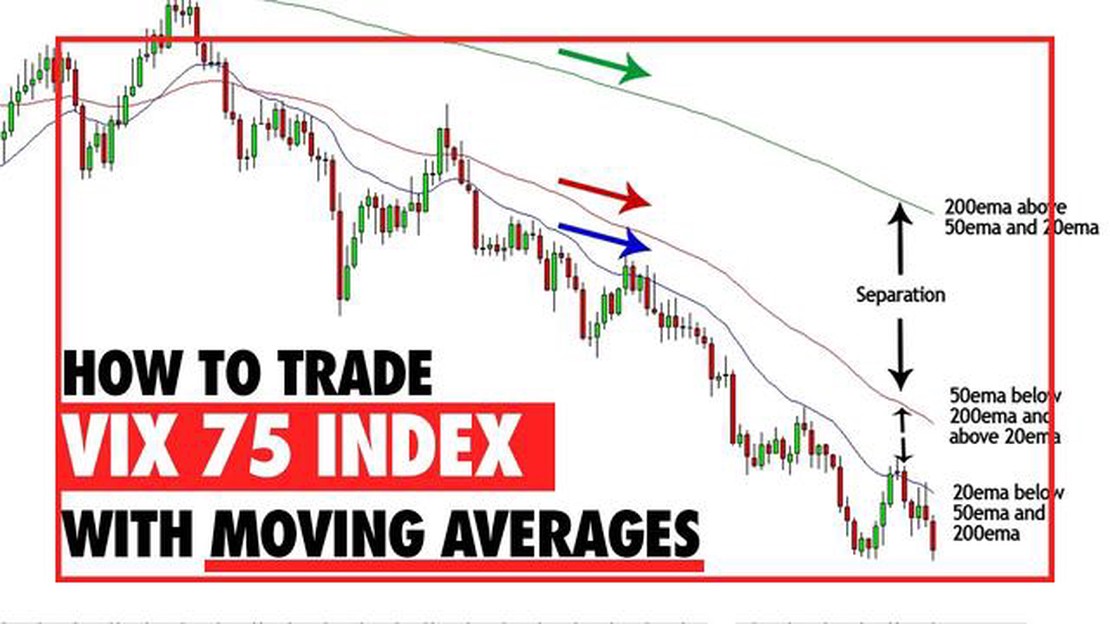
The 50-day moving average of the VIX is a popular technical indicator used by traders and investors to analyze the volatility of the stock market. It is calculated by taking the average closing prices of the VIX over the past 50 trading days and plotting the result on a chart. This moving average line provides valuable information about the overall trend and direction of the VIX.
When the 50-day moving average is sloping upwards, it suggests that the volatility is increasing in the market. This may indicate a period of uncertainty or fear among investors, which can lead to heightened levels of market volatility. Traders and investors may interpret this as a sign to be cautious and consider adjusting their investment strategies accordingly.
Conversely, when the 50-day moving average is sloping downwards, it suggests that the volatility is decreasing in the market. This may indicate a period of stability and confidence among investors, which can lead to lower levels of market volatility. Traders and investors may interpret this as a sign of a calming market and may adjust their investment strategies accordingly.
In addition to the slope, the distance between the actual VIX value and the 50-day moving average line is also important in interpreting the indicator. When the VIX is far above the 50-day moving average, it suggests that the volatility is high and the market may be in a state of panic or fear. Conversely, when the VIX is far below the 50-day moving average, it suggests that the volatility is low and the market may be in a state of complacency or optimism.
It is important to note that the 50-day moving average of the VIX is just one tool among many used to analyze the stock market. It should not be used as the sole basis for making investment decisions, but rather as a part of a comprehensive analysis that takes into account other indicators and factors.
Overall, the 50-day moving average of the VIX provides valuable insights into the volatility of the stock market. Traders and investors can use this indicator to gauge the overall trend and direction of the VIX and make informed decisions about their investment strategies.
FAQ:
What is the VIX?
The VIX is a popular ticker symbol for the CBOE Volatility Index, which is a real-time market index that represents the market’s expectation of 30-day forward-looking volatility. It is often referred to as the “fear index” as it tends to spike during times of market turmoil and uncertainty.
What is a moving average?
A moving average is a commonly used statistical indicator that helps to smooth out price data over a certain period of time. It is calculated by taking the average of a specified number of data points over the chosen period. It is called a “moving” average because it is constantly updated as new data becomes available, providing a moving picture of the underlying trend.
Why is the 50-day moving average of the VIX important?
The 50-day moving average of the VIX is important because it can provide valuable insight into the long-term trend and direction of market volatility. Traders and investors often use it as a reference point to gauge whether the VIX is currently in a high or low volatility environment. It can also help identify potential turning points or reversals in market sentiment.
How is the 50-day moving average of the VIX calculated?
The 50-day moving average of the VIX is calculated by taking the average of the daily closing values of the VIX over the past 50 trading days. Each day, the oldest data point is dropped, and the newest data point is added, resulting in a constantly updated average that reflects the most recent 50 trading days.
How can traders use the 50-day moving average of the VIX in their trading strategies?
Traders can use the 50-day moving average of the VIX in a variety of ways. Some traders may use it as a reference point to determine when the VIX is in an overbought or oversold condition. Others may use it as a signal for potential changes in market sentiment or as a confirmation tool for other technical indicators. Ultimately, how it is used will depend on the individual trader’s strategy and objectives.
Options: Physically Settled or Cash Settled? Options are a type of financial derivative that gives the buyer the right, but not the obligation, to buy …