


How to Identify Cross Trade: A Comprehensive Guide
Ways to Identify Cross Trade Identifying cross trade is crucial for businesses engaged in international trade. Cross trade involves the buying and …
Read Article
Successful trading in the financial markets requires a careful analysis of various indicators and signals. Traders rely on a plethora of tools and techniques to make informed decisions and maximize their profits. However, with an overwhelming number of indicators available, finding the perfect combination can be challenging.
Every indicator has its strengths and weaknesses, and no single indicator can provide a complete picture of market trends and movements. That’s why experienced traders often use a combination of indicators to complement each other’s strengths and to mitigate their weaknesses. By doing so, they increase the accuracy of their predictions and reduce the risk of false signals.
Some popular indicators used by traders include moving averages, oscillators, trendlines, and volume analysis. Moving averages are used to identify trends and support and resistance levels. Oscillators measure overbought or oversold conditions, allowing traders to identify potential reversals. Trendlines help identify the direction of the market, while volume analysis examines the intensity of buying or selling pressure.
Combining these indicators can provide traders with a holistic view of the market, helping them make better-informed decisions and achieve more consistent results.
While there are no universal rules for finding the perfect combination of indicators, traders typically look for indicators that complement each other and confirm signals. For example, if a moving average indicates a trend change, traders may look for confirmation from an oscillator or volume analysis. By using multiple indicators, traders can reduce the likelihood of false signals and increase the probability of successful trades.

Ultimately, the perfect combination of indicators will vary from trader to trader and depend on their trading style, risk tolerance, and time frame. It requires extensive research, backtesting, and experimentation to find the indicators that work best for an individual trader. However, with dedication and perseverance, traders can discover the ideal combination of indicators that gives them a competitive edge in the financial markets.
Trading indicators play a crucial role in the success of any trading strategy. These indicators are mathematical calculations based on historical price data and other market variables. They are used by traders to analyze market trends, identify potential entry and exit points, and make informed trading decisions.
One of the key benefits of using trading indicators is that they help traders to reduce uncertainty and increase their chances of making profitable trades. By providing objective and quantifiable information about the market, indicators help traders to avoid emotional and impulsive decision-making.
Read Also: Does Savage use Boyds stocks? Find out here.
Trading indicators also help traders to identify market patterns and trends that are not easily visible to the naked eye. They can highlight potential support and resistance levels, price reversals, and other important price action signals. By spotting these patterns, traders can take advantage of market movements and make timely trades.
Moreover, trading indicators can be used to confirm or validate other technical analysis tools. For example, if a trader identifies a potential trade setup based on a trendline break, they can use indicators like moving averages or oscillators to confirm the validity of the setup. This can provide traders with additional confidence in their trading decisions.
However, it is important to note that trading indicators are not foolproof and should not be used in isolation. They are just one tool in a trader’s toolbox and should be used in conjunction with other forms of analysis and risk management strategies.
In conclusion, trading indicators are essential tools for traders looking to improve their trading performance. They provide valuable insights into market trends, help traders make informed decisions, and increase the chances of making profitable trades. By understanding and effectively utilizing trading indicators, traders can enhance their trading strategies and achieve their financial goals.
Indicators play a crucial role in technical analysis for traders. By utilizing various indicators, traders can identify potential trading opportunities and make informed decisions. In this section, we will explore some of the most popular types of indicators used in trading.
| Indicator Type | Description |
|---|---|
| Trend Indicators | Trend indicators help traders identify the direction in which a particular asset is moving. They include moving averages, trendlines, and the Average Directional Index (ADX). |
| Momentum Indicators | Momentum indicators measure the speed and strength of price movements. They can help traders identify overbought or oversold conditions and potential trend reversals. Popular momentum indicators include the Relative Strength Index (RSI), Stochastic Oscillator, and Moving Average Convergence Divergence (MACD). |
| Volatility Indicators | Volatility indicators measure the extent of price fluctuations in the market. They are used to identify potential breakouts or changes in market conditions. The Bollinger Bands, Average True Range (ATR), and the Volatility Index (VIX) are common volatility indicators. |
| Volume Indicators | Volume indicators analyze the trading volume of a particular asset. They provide insights into the strength of a trend or reversal and can help traders confirm or invalidate trading signals. Examples of volume indicators include the Volume Weighted Average Price (VWAP), On-Balance Volume (OBV), and the Money Flow Index (MFI). |
| Oscillators | Oscillators are indicators that fluctuate within a specific range and can be used to identify overbought or oversold conditions. They help traders determine possible entry or exit points in the market. Popular oscillators include the Moving Average Convergence Divergence (MACD), Relative Strength Index (RSI), and the Stochastic Oscillator. |
Read Also: Learn How to Calculate Pips in Forex with our Detailed PDF Guide
It is important to note that no single indicator can guarantee accurate predictions in trading. Traders often combine multiple indicators or use them in conjunction with other technical analysis tools to increase their probabilities of success. The choice of indicators ultimately depends on the trader’s trading style, preferences, and the specific market conditions they are analyzing.
By exploring different types of indicators and understanding how they work, traders can develop their own trading strategies and improve their chances of making profitable trades.
Indicators in trading are mathematical calculations applied to a financial instrument’s price and/or volume to assist traders in making informed trading decisions.

Traders use indicators by overlaying them on price charts to identify patterns, trends, and possible future price movements. They can use indicators to generate buy or sell signals or as a confirmation tool for their trading strategies.
When choosing indicators, traders should consider their trading style, time frame, risk tolerance, and the market they are trading. They should also consider how well the indicator aligns with their trading strategy and whether it provides reliable and accurate signals.
Using too many indicators can be counterproductive as it can lead to information overload and conflicting signals. It is generally recommended to use a combination of indicators that complement each other and provide a clear and simplified view of the market.

Ways to Identify Cross Trade Identifying cross trade is crucial for businesses engaged in international trade. Cross trade involves the buying and …
Read Article
Foreign Currency Deposits at CIBC: All You Need to Know Yes, you can deposit foreign currency at CIBC! CIBC offers a convenient solution for customers …
Read Article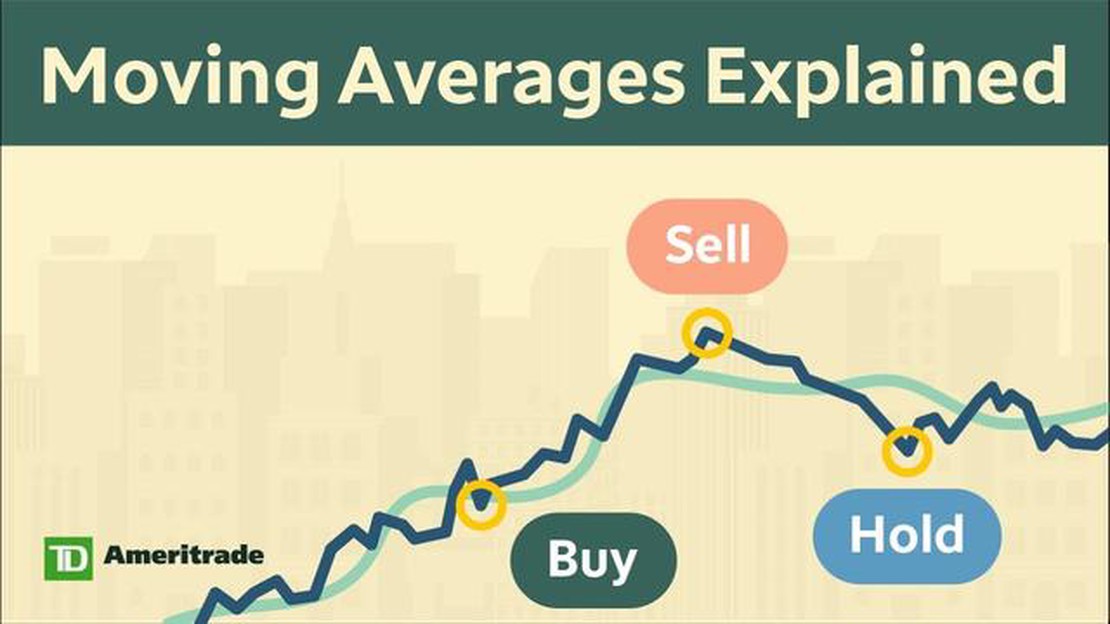
Using Moving Average in Data Analysis: A Comprehensive Guide The moving average is a widely used statistical technique in data analysis that helps in …
Read Article
Understanding the 50-day Moving Average Trend The 50-day moving average trend is a popular technical indicator used by traders and investors to …
Read Article
Historical Highs: The Price of Brent Oil Reaches New Heights The price of Brent oil has been making headlines recently as it continues to climb to …
Read Article
What is a Good INR Rate? When it comes to foreign exchange rates, the Indian Rupee (INR) is a currency that is closely watched by global markets. …
Read Article


