


Are stock options available for FedEx employees?
Are FedEx Employees Eligible for Stock Options? Employee stock options are a common form of compensation that many companies offer to their employees. …
Read Article
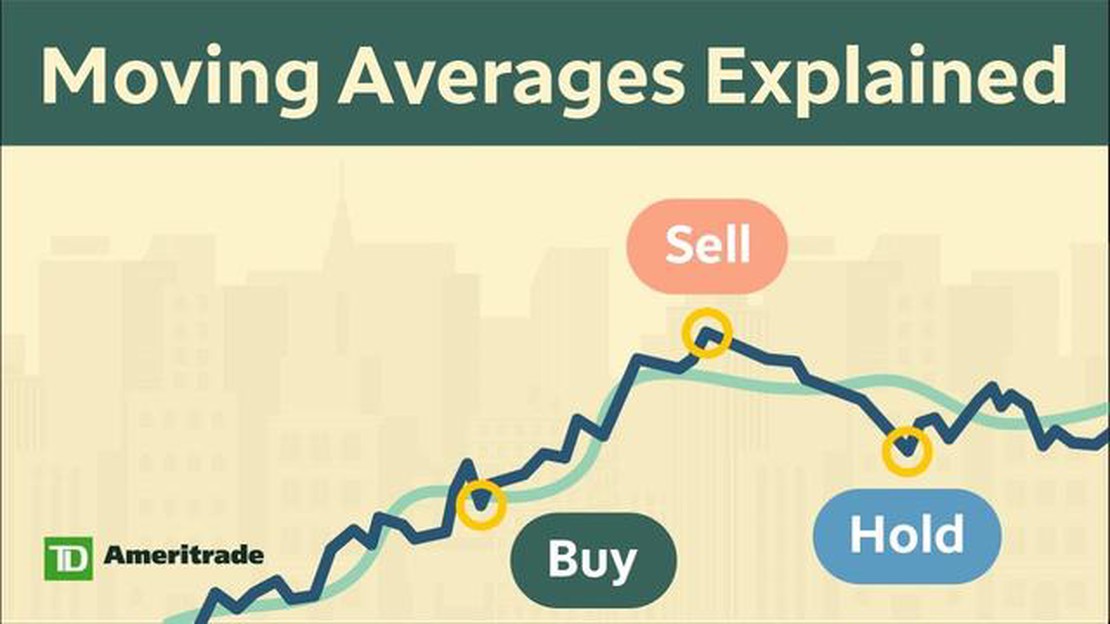
The 50-day moving average trend is a popular technical indicator used by traders and investors to analyze market trends and predict future price movements. It is calculated by taking the average closing price of a security over the past 50 trading days. By smoothing out short-term fluctuations, the 50-day moving average provides a clearer picture of the overall trend and helps identify potential buying or selling opportunities.
Traders and investors use the 50-day moving average as a tool to determine the overall direction of a security’s price movement. When the price is above the 50-day moving average, it is considered to be in an uptrend, indicating a bullish sentiment. On the other hand, when the price is below the 50-day moving average, it is considered to be in a downtrend, indicating a bearish sentiment.
The 50-day moving average trend can have a significant impact on markets as it is widely followed by market participants. When the price crosses above the 50-day moving average, it is often seen as a bullish signal, leading to increased buying activity and pushing the price higher. Conversely, when the price crosses below the 50-day moving average, it is often seen as a bearish signal, leading to increased selling activity and pushing the price lower.
However, it is important to note that the 50-day moving average is just one of many tools used by traders and investors, and it should not be used in isolation to make investment decisions. Other technical indicators, fundamental analysis, and market conditions should also be taken into consideration. Additionally, the 50-day moving average is not foolproof and can sometimes produce false signals, so it is essential to use it in conjunction with other indicators to confirm the trend.
In conclusion, understanding the 50-day moving average trend and its impact on markets is crucial for traders and investors. By analyzing this indicator, market participants can gain insights into market trends and make informed trading decisions. While it is not a guarantee of future price movements, the 50-day moving average provides valuable information that can help identify potential trading opportunities.
The 50-day moving average (MA) is a technical indicator commonly used by traders and investors to analyze trends in the market. It is calculated based on the average closing price of a security over the previous 50 trading days. By plotting the 50-day MA on a price chart, market participants can gain insights into the overall direction and strength of the trend.
One key benefit of the 50-day MA is its ability to smooth out short-term price fluctuations. This moving average takes into account a relatively longer time frame compared to shorter moving averages, such as the 10-day or 20-day MA. As a result, it provides a clearer picture of the underlying trend and reduces the impact of daily volatility. Traders often use the 50-day MA to filter out noise and identify the primary trend in a market.

When the price is above the 50-day MA, it is considered a bullish signal. This indicates that the security is trading higher than its average price over the past 50 days, suggesting upward momentum and potential buying opportunities. On the other hand, when the price is below the 50-day MA, it is seen as a bearish signal, signaling that the security is trading below its average price and indicating a potential downward trend.
The 50-day MA can also serve as a support or resistance level. During uptrends, it often acts as a support level, where the price may bounce off or find buying interest near the 50-day MA. Conversely, during downtrends, it can act as a resistance level where the price may struggle to break above. These support and resistance levels can provide traders with potential entry or exit points.
Read Also: Discover the Most Effective Strategy for 1-Minute Trading
Traders commonly use the 50-day MA in conjunction with other technical analysis tools. For example, they may combine it with shorter-term moving averages, such as the 10-day or 20-day MA, to generate crossover signals. A bullish crossover occurs when the shorter-term MA crosses above the 50-day MA, indicating a potential buy signal. Conversely, a bearish crossover occurs when the shorter-term MA crosses below the 50-day MA, suggesting a potential sell signal.
In conclusion, the 50-day moving average is a widely used technical indicator that helps traders and investors identify trends, smooth out short-term price fluctuations, and determine potential support and resistance levels. By incorporating it into their analysis, market participants can make more informed trading decisions and capitalize on favorable market conditions.
The 50-day moving average is a widely used technical indicator in financial markets. It is calculated by taking the average closing price of a security over the past 50 trading days. This indicator is often used by traders and investors to identify trends and make trading decisions.
The 50-day moving average is considered a short-term trend indicator as it reflects the average price over a relatively short period of time. It helps smooth out the price data and remove any short-term price fluctuations, allowing traders to focus on the overall trend.
When the price of a security is trading above its 50-day moving average, it is generally seen as a bullish signal. This suggests that the security is in an uptrend and there is buying pressure in the market. Traders may use this as a signal to enter a long position or stay invested.
Conversely, when the price is below its 50-day moving average, it is often seen as a bearish signal. This indicates that the security is in a downtrend and there is selling pressure in the market. Traders may interpret this as a signal to enter a short position or exit existing long positions.
Read Also: IQ Bot Accuracy: Evaluating the Precision of Artificial Intelligence
It is important to note that the 50-day moving average is just one tool among many used by traders and investors. It is not a foolproof indicator and should be used in conjunction with other technical and fundamental analysis tools for more accurate predictions.
In conclusion, the 50-day moving average is a key technical indicator that helps traders identify trends in financial markets. It is used to smooth out price data and provide signals for entry and exit points. However, it should be used with caution and in combination with other tools for effective trading strategies.

The 50-day moving average is a technical analysis tool used by traders and investors to identify the current trend in a stock or market. It is calculated by averaging the closing prices of an asset over the past 50 trading days.
The 50-day moving average is used in trading to determine when to buy or sell a stock. When the price of a stock crosses above the 50-day moving average, it is seen as a bullish signal, indicating that the stock may continue to rise. Conversely, when the price crosses below the 50-day moving average, it is seen as a bearish signal, indicating that the stock may continue to decline.
When the 50-day moving average is trending upward, it indicates that the overall trend of the market or stock is bullish. This may be a sign that the stock is in an uptrend and may continue to rise in price. Traders may interpret this as a buying opportunity.
The 50-day moving average can be used for all types of stocks and markets. However, its effectiveness may vary depending on the stock or market being analyzed. Some traders may prefer to use a shorter or longer moving average, depending on their trading strategy and time frame.
While the 50-day moving average can be a useful tool for identifying trends, it is not foolproof and should not be relied upon as the sole basis for making trading decisions. It is important to consider other factors, such as fundamental analysis and market conditions, when making investment decisions.

Are FedEx Employees Eligible for Stock Options? Employee stock options are a common form of compensation that many companies offer to their employees. …
Read Article
Understanding the Moving Average in VBA The moving average is a widely used statistical indicator in technical analysis that helps traders and …
Read Article
One of the most used strategies for automated trading Automated trading has become an increasingly popular method of investing in financial markets. …
Read Article
Simple Steps to Download MT4 on Android MetaTrader 4 (MT4) is a popular trading platform among forex traders, known for its advanced features and …
Read Article
Is there a mobile app for forex trading? Are you tired of being tied to your computer while trading in the forex market? Do you wish you could trade …
Read Article
Best One-Minute Forex Indicator: A Comprehensive Analysis When it comes to forex trading, timing is everything. Being able to identify the right …
Read Article

