Understanding the Zig Zag Indicator: A Detailed Explanation
The Zig Zag indicator is a popular technical analysis tool used in the financial markets to identify trend reversals and price movements. It is a versatile tool that can be used by traders and investors of all experience levels to make informed decisions.
Table Of Contents
The main purpose of the Zig Zag indicator is to filter out market noise and reveal the underlying trend. It does this by connecting significant price points, such as highs and lows, and ignoring minor price fluctuations. This helps traders identify important levels of support and resistance and make more accurate predictions about future price movements.
One of the key features of the Zig Zag indicator is its ability to automatically adjust to different market conditions. It uses a user-defined parameter, typically a percentage or a number of pips, to determine the minimum price movement required for a new trend line to be drawn. This flexibility makes it suitable for various types of markets, including volatile and range-bound markets.
Traders can utilize the Zig Zag indicator in a number of ways. They can use it to identify potential entry and exit points, by waiting for a trend line to be broken or a trend reversal to occur. Additionally, the indicator can be used in conjunction with other technical analysis tools, such as moving averages or oscillators, to confirm signals and increase the likelihood of successful trades.
Overall, understanding the functionality of the Zig Zag indicator can greatly enhance a trader’s ability to analyze price movements and make informed decisions. By filtering out noise and highlighting important trend lines, the Zig Zag indicator can provide valuable insights into market trends and help traders identify profitable trading opportunities.
What is the Zig Zag Indicator?
The Zig Zag indicator is a popular technical analysis tool used by traders to identify potential trend reversals in financial markets. It is a lagging indicator that helps to filter out market noise and focus on significant price movements.
The Zig Zag indicator plots lines on a price chart that connect significant highs and lows. It eliminates minor price fluctuations and draws attention to the most important price swings. This indicator is based on a certain percentage or number of points that determines how much price movement is required to create a new zig or zag line.
When the price exceeds the specified percentage or point threshold, a new line is drawn in the direction of the price movement. This line remains unchanged until the price surpasses the threshold in the opposite direction, at which point a new line is drawn.
Traders commonly use the Zig Zag indicator to identify support and resistance levels, as well as to spot potential trend reversals. The indicator can help traders determine whether a market is trending or in a range. It can also assist in identifying significant price levels where traders may take action, such as entering or exiting positions.
It is important to note that the Zig Zag indicator should not be used in isolation but in combination with other technical analysis tools and indicators for more accurate predictions. Traders often use it alongside moving averages, oscillators, and other trend-following indicators to confirm signals and avoid false alarms.
Overall, the Zig Zag indicator is a valuable tool for technical analysts and traders, as it helps to identify significant price movements and potential trend reversals in financial markets.
The Zig Zag indicator is an important technical analysis tool used in the financial markets. It is primarily used to identify and visualize significant price trends and filter out the noise and smaller price fluctuations.
One of the main advantages of the Zig Zag indicator is its ability to highlight important price reversals. By connecting the swing highs and swing lows, it forms a series of lines on a chart that help traders identify key support and resistance levels. These levels are crucial in determining potential entry and exit points for trades.
Additionally, the Zig Zag indicator can also help traders identify the strength and duration of a trend. By measuring the distance between the swing highs and swing lows, traders can get an idea of the magnitude of price movements. This can be useful in assessing the volatility and potential profitability of a trade.
Furthermore, the Zig Zag indicator is useful for filtering out noise and false signals that may be caused by random price fluctuations. It helps traders focus on the bigger picture and avoid getting distracted by small, insignificant price movements. By doing so, traders can make more informed decisions and reduce the risk of entering trades based on false signals.
In conclusion, the Zig Zag indicator is an important tool for technical analysis as it helps traders identify significant price trends, potential reversals, and support and resistance levels. It enables traders to make more accurate predictions and better navigate the financial markets, ultimately increasing their chances of success in trading.
How Does the Zig Zag Indicator Work?
The Zig Zag indicator is a technical analysis tool that helps traders identify significant price reversals. It does this by filtering out the insignificant price movements and only focusing on the key price changes. This indicator can be used in various markets, such as stocks, forex, and commodities, to assist in identifying potential trend reversals.
The Zig Zag indicator works by connecting significant highs and lows in a chart with straight lines. It ignores the small price fluctuations within a trend and only connects the points that have a certain percentage or price change threshold. By doing so, it effectively eliminates the noise in the price data and provides a clearer view of the major price movements.
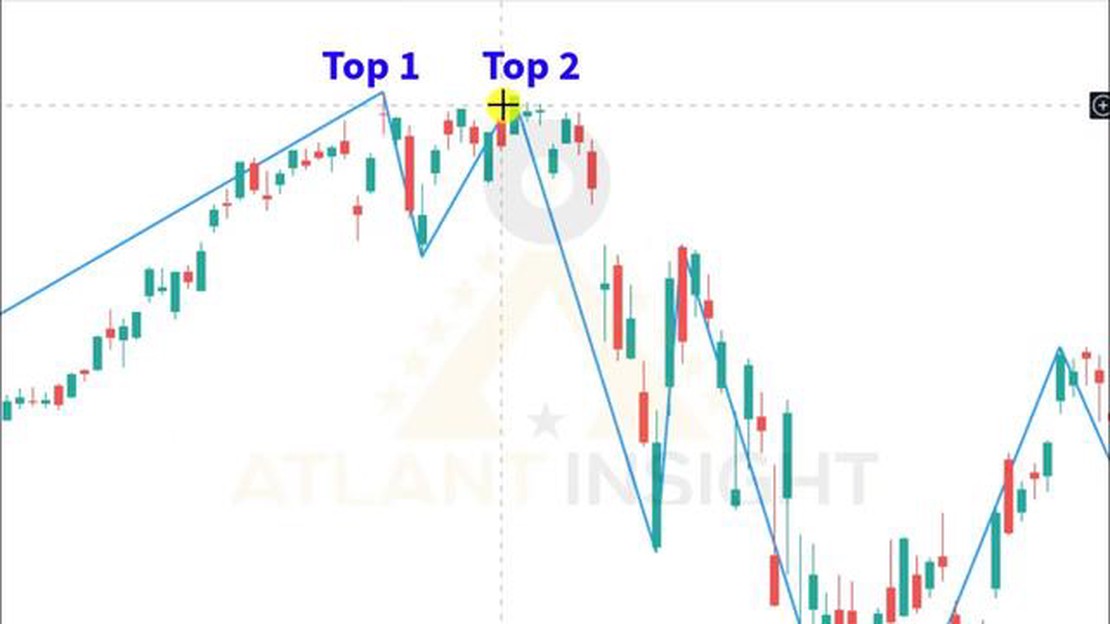
The indicator calculates the swing highs and swing lows by analyzing the price action. A swing high is formed when a price peak is followed by two lower peaks on both sides, indicating a potential trend change. Conversely, a swing low is formed when a price trough is followed by two higher troughs on both sides. These swing points are crucial as they mark the key turning points in the price movement.
Once the Zig Zag indicator identifies a swing high or swing low, it connects these points with a line, creating a zigzag pattern on the chart. The length of the lines can vary depending on the selected parameters, such as the percentage or price change threshold. Traders can customize these parameters based on their trading strategy and the market being analyzed.
By using the Zig Zag indicator, traders can easily visualize the major price reversals and potentially spot important trend changes. It can help traders identify support and resistance levels, trend lines, and chart patterns more accurately. However, it is important to note that the Zig Zag indicator is a lagging indicator, which means it may not provide real-time signals and can be subject to false signals. Therefore, it is best used in conjunction with other technical analysis tools and indicators to confirm the signals.
FAQ:
What is the Zig Zag indicator?
The Zig Zag indicator is a technical analysis tool used to identify trend reversals and filter out market noise. It helps traders visually see the direction of the market by connecting the swing highs and swing lows on a price chart.
How does the Zig Zag indicator work?
The Zig Zag indicator works by creating lines that connect the most significant swing highs and swing lows on a price chart. It filters out minor price movements and focuses on the larger trend. When the market is trending upward, the Zig Zag indicator connects the lowest low and the next highest high. When the market is trending downward, it connects the highest high and the next lowest low.
What are the benefits of using the Zig Zag indicator?
The Zig Zag indicator helps traders identify trend reversals and filter out market noise. It provides a clear visual representation of the market’s direction and can help traders make more informed trading decisions. It is also easy to use and can be applied to various timeframes and markets.
Can the Zig Zag indicator be used alone?
The Zig Zag indicator can be used alone, but it is often used in conjunction with other technical analysis tools to confirm signals and identify potential trade setups. Combining the Zig Zag indicator with other indicators or price patterns can enhance its effectiveness.
How can I interpret the Zig Zag indicator?
To interpret the Zig Zag indicator, traders should look for significant swing highs and swing lows on the price chart. When the indicator connects a series of higher swing highs and higher swing lows, it indicates an uptrend. When it connects a series of lower swing highs and lower swing lows, it indicates a downtrend. Traders can look for opportunities to enter a trade or take profits based on these trends.
Competitors of Eightcap: A Comprehensive Analysis When it comes to the trading industry, Eightcap faces stiff competition from a number of top rivals. …