


Understanding the Capital Forex Market: Benefits and Key Concepts
Understanding the Capital Forex Market The global foreign exchange (forex) market, also known as the Capital Forex Market, is the most liquid and …
Read Article
The exponentially weighted moving average (EWMA) is a statistical method used to calculate the average of a series of data points over time. Unlike a simple moving average, which gives equal weight to all data points, the EWMA assigns exponentially decreasing weights to the data points based on their age. This means that more recent data points have a greater impact on the average than older ones. The EWMA is commonly used in finance, engineering, and other fields to filter out noise and reveal underlying trends in time series data.
One of the key advantages of the EWMA is its ability to adapt to changing conditions and trends in the data. By giving more weight to recent data points, the EWMA is able to quickly respond to sudden changes or anomalies in the data, while still taking into account historical patterns. This makes it useful for detecting and reacting to events such as market fluctuations or equipment failures. In addition, the EWMA can be easily adjusted to give more or less weight to recent data points as needed, allowing for greater flexibility in analysis.
The EWMA is often used in conjunction with other statistical methods, such as control charts, to monitor and control processes. By calculating the average of a series of data points and comparing it to control limits, the EWMA can help identify when a process is out of control or deviating from expected patterns. This can be especially useful in industries where quality control and consistency are critical, such as manufacturing or healthcare.
In summary, the exponentially weighted moving average is a powerful statistical tool for analyzing and interpreting time series data. Its ability to adapt to changing conditions and its flexibility in adjusting the weight given to recent data points make it a valuable tool in various fields. By using the EWMA, analysts can gain insights into trends, detect anomalies, and make more informed decisions based on the underlying patterns in the data.
The Exponentially Weighted Moving Average (EWMA) is a statistical method used to analyze data points over time, giving more weight to recent data points while gradually decreasing the weight of older data points. This is achieved by assigning exponentially decreasing weights to each data point as it gets older.
EWMA is commonly used in finance and statistics for time series analysis, forecasting, and smoothing. It is particularly useful for detecting patterns, trends, and anomalies in data that might be obscured by noise or short-term fluctuations.
Unlike simple moving averages, which give equal weight to all data points, EWMA adapts to changes in the data by assigning more importance to recent observations. This makes it more responsive to shifts in the underlying patterns and helps in identifying emerging trends.
The calculation of EWMA involves two key parameters: the smoothing factor (λ) and the initial value (V). The smoothing factor determines the rate at which the weights decrease and usually takes a value between 0 and 1. A smaller λ places more weight on recent data points, while a larger λ gives more weight to older data points.
The initial value (V) is the starting point for the calculation and can be set to the first observed value or an average of the initial data points. The choice of the initial value can have an impact on the behavior and sensitivity of the EWMA calculation.
To calculate the EWMA, the following formula is typically used:
| Yt = λ * Xt + (1 - λ) * Yt-1 |

Where:
The EWMA calculation is often used in combination with other statistical methods and models to analyze and interpret data, such as in time series forecasting, trend analysis, and anomaly detection. By giving more weight to recent data points, the EWMA helps in capturing and reacting to changes in the underlying patterns, making it a valuable tool in data analysis and decision-making processes.
The calculation of the exponentially weighted moving average (EWMA) involves assigning weights to each observed data point. The weights decrease exponentially as the observations move away from the current time period. The formula to calculate the EWMA is as follows:
EWMA = (1 - α) * Previous EWMA + α * Current Observation
Where:
Read Also: Potential NFL Trade Candidates: Who Could be on the Move?
The smoothing factor, α, is a parameter that determines the rate at which the weights decrease. A higher α leads to a faster decay of the weights, giving more importance to recent observations. Conversely, a lower α leads to a slower decay and gives more importance to past observations. The choice of α depends on the data being analyzed and the desired level of smoothing.
To calculate the EWMA, you start with an initial value for the moving average, usually based on the first observed data point. Then, you iterate through the data points, updating the EWMA using the formula above. The resulting EWMA value is a smoothed estimate of the underlying process, taking into account the decay of past observations.
Read Also: Discover the Must-Have Apps on My iPhone | A Comprehensive Guide
The EWMA is commonly used in finance, economics, and signal processing to analyze time series data. It is particularly useful for detecting trends, filtering out noise, and generating forecasts based on historical observations. By assigning more weight to recent data points, the EWMA provides a balance between responsiveness to changes and stability in the estimates.
Overall, the exponentially weighted moving average is a powerful tool for analyzing and forecasting time series data. Its calculation is straightforward and can be easily implemented in various programming languages.
The formula for calculating the Exponentially Weighted Moving Average (EWMA) is as follows:
EWMAt = (1 - α) * EWMAt-1 + α * Observationt
Where:

This formula calculates the EWMA by giving more weight to recent observations and less weight to older observations. The value of α determines the rate at which the weights decrease. Smaller values result in a smoother EWMA that reacts more slowly to changes in the data, while larger values result in a more volatile EWMA that reacts more quickly to changes.
The EWMA is commonly used in finance and quality control to smooth out data and identify trends or anomalies. It is particularly useful in scenarios where recent observations carry more significance or where there is a need to emphasize recent data points over older ones.
An Exponentially Weighted Moving Average (EWMA) is a type of moving average that assigns exponentially decreasing weights to the previous observations in a time series. This means that more weight is given to the recent observations and less weight is given to the older observations.
Exponentially Weighted Moving Average (EWMA) has various applications in finance, economics, engineering, and other fields. Some common applications include forecasting stock prices, analyzing trends in economic data, and filtering noisy signals in engineering.
The smoothing factor in Exponentially Weighted Moving Average (EWMA) is determined by the choice of the decay parameter, which is a value between 0 and 1. A smaller decay parameter puts more weight on recent observations, while a larger decay parameter puts more weight on older observations.
One advantage of using Exponentially Weighted Moving Average (EWMA) is that it gives more weight to recent observations, allowing it to quickly adjust to changes in the underlying data. Additionally, EWMA does not require the storage of all previous data points, making it computationally efficient.
Yes, Exponentially Weighted Moving Average (EWMA) can be used for outlier detection. By comparing the current observation to the EWMA value, it is possible to identify data points that deviate significantly from the expected trend. These deviations can be considered as potential outliers.
The Exponentially Weighted Moving Average (EWMA) is a statistical method used to analyze time series data. It puts more weight on recent data points and less weight on older data points to provide a smoothed estimation of the data’s trend.
The weighting factor in the EWMA is usually determined by a decay factor, which determines the rate at which the weights decrease for older data points. The decay factor is typically chosen based on the desired smoothness of the resulting trend estimation.

Understanding the Capital Forex Market The global foreign exchange (forex) market, also known as the Capital Forex Market, is the most liquid and …
Read Article
Regulation of Forex Brokers in the US Forex trading has become increasingly popular in the United States, attracting many investors who are looking to …
Read Article
An Example of Intermarket Analysis When it comes to making investment decisions, there are many factors to consider. One approach that can provide …
Read Article
Today’s Interbank Dollar to PKR Rate Welcome to our daily update on the interbank dollar to PKR exchange rate! If you’re interested in staying …
Read Article
Unveiling the Mystery behind Binary Trading Binary trading has quickly gained popularity as a way to make money online. It promises quick profits and …
Read Article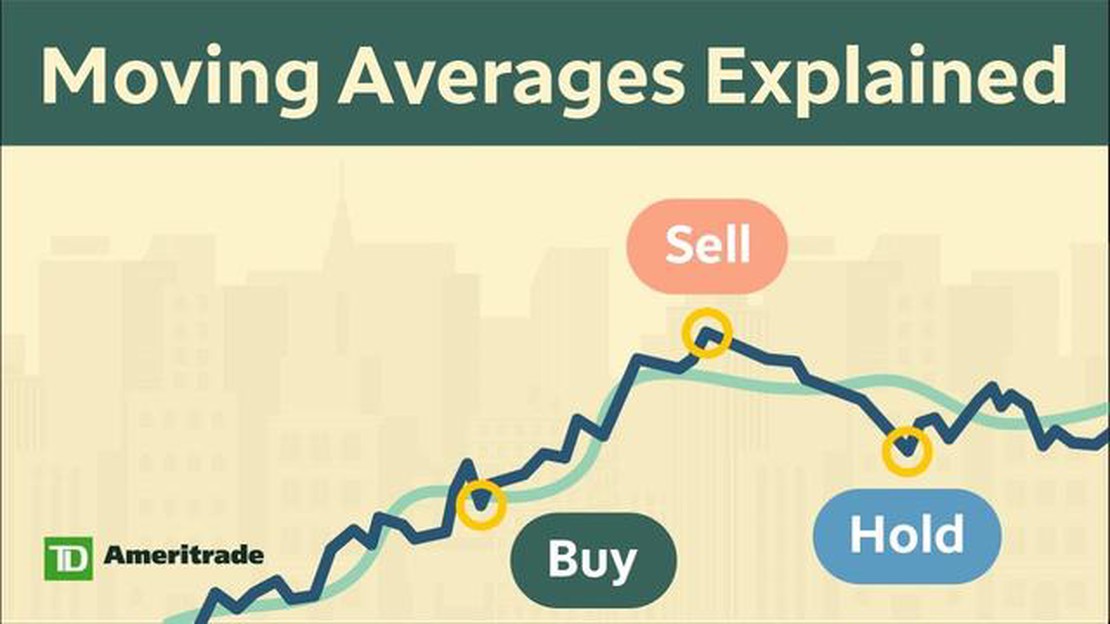
Understanding the 50-day Moving Average Trend The 50-day moving average trend is a popular technical indicator used by traders and investors to …
Read Article


