


Discover the Dow Jones Future Forecast: Expert Insights and Projections
Discover the Dow Jones Future Forecast The Dow Jones Future Forecast is an essential tool for investors and traders looking to stay ahead of the …
Read Article
The Directional Movement Index (DMI) is a popular technical analysis indicator used to identify the strength and direction of a trend in financial markets. Developed by J. Welles Wilder, Jr., in the late 1970s, the DMI consists of several components that provide valuable insights into market dynamics.
The DMI indicator comprises the following key types:
The DMI indicator can be applied in various ways to assist traders in making informed decisions. By analyzing the +DI and -DI values, traders can identify potential trading opportunities and assess the strength of a trend. The ADX reading, on the other hand, helps traders determine whether a market is trending or ranging.
By understanding the different components of the DMI indicator and their applications, traders can gain a deeper understanding of market trends and make more informed trading decisions.
Understanding the DMI Indicator: Key Types and Applications is a essential milestone for traders seeking to improve their technical analysis skills and enhance their trading strategies.
The DMI (Directional Movement Index) indicator is a popular technical analysis tool used to identify the strength and direction of a current trend in the market. It was developed by J. Welles Wilder and was first introduced in his book, “New Concepts in Technical Trading Systems,” in 1978.
The DMI indicator consists of three components: the Average Directional Index (ADX), the Positive Directional Indicator (+DI), and the Negative Directional Indicator (-DI). These three components work together to provide traders with information about the market trend and the potential for a trend reversal.

The Average Directional Index (ADX) is the core component of the DMI indicator. It measures the strength of the current trend using a scale of 0 to 100. A high ADX value indicates a strong trend, while a low value suggests a weak or non-existent trend. Traders can use the ADX to determine whether to enter a trade or to stay on the sidelines.
The Positive Directional Indicator (+DI) and the Negative Directional Indicator (-DI) gauge the upward and downward movement of the price respectively. These indicators are used to determine the direction of the trend. When the +DI is above the -DI, it suggests a bullish trend, while a -DI above the +DI indicates a bearish trend.
Traders often use a combination of these three components to analyze the DMI indicator. By assessing the ADX, +DI, and -DI together, traders can gain a better understanding of the strength and direction of a trend, and can make more informed trading decisions.
Read Also: Understanding the FTSE MIB 40 Index: Everything You Need to Know
The DMI indicator can be applied to various time frames and different markets, including stocks, commodities, and forex. It is a versatile tool that can be used by both novice and experienced traders to improve their trading strategies.
The DMI (Directional Movement Index) indicator, also known as the Average Directional Index (ADX), is a popular technical analysis tool used to analyze and understand the strength and direction of a trend in the financial markets. It was developed by J. Welles Wilder Jr. and introduced in his book “New Concepts in Technical Trading Systems” in 1978.
The DMI indicator consists of three lines: the Positive Directional Indicator (+DI), the Negative Directional Indicator (-DI), and the ADX line. The +DI line measures the strength of the uptrend, the -DI line measures the strength of the downtrend, and the ADX line measures the overall strength of the trend.
The DMI indicator is based on the concept of directional movement, which aims to identify whether the market is trending or not. It calculates the difference between two consecutive days’ highs and lows and compares it to the previous day’s range to determine the strength of the trend. A positive value indicates an uptrend, a negative value indicates a downtrend, and a value close to zero indicates a weak or non-existent trend.
The DMI indicator is widely used by traders and investors to identify and confirm trends, determine entry and exit points, and assess the strength of a trend. It can be used in various markets, including stocks, commodities, and currencies. However, like any technical analysis tool, it is not foolproof and should be used in conjunction with other indicators and analysis techniques for more accurate and reliable results.
The DMI (Directional Movement Indicator) is a technical analysis tool that helps traders determine the strength and direction of a trend. There are three main types of DMI indicators:
1. Average Directional Index (ADX): The ADX is used to measure the strength of a trend. It ranges from 0 to 100, with values above 25 indicating a strong trend. Traders use the ADX to identify whether a market is trending or in a range-bound condition.
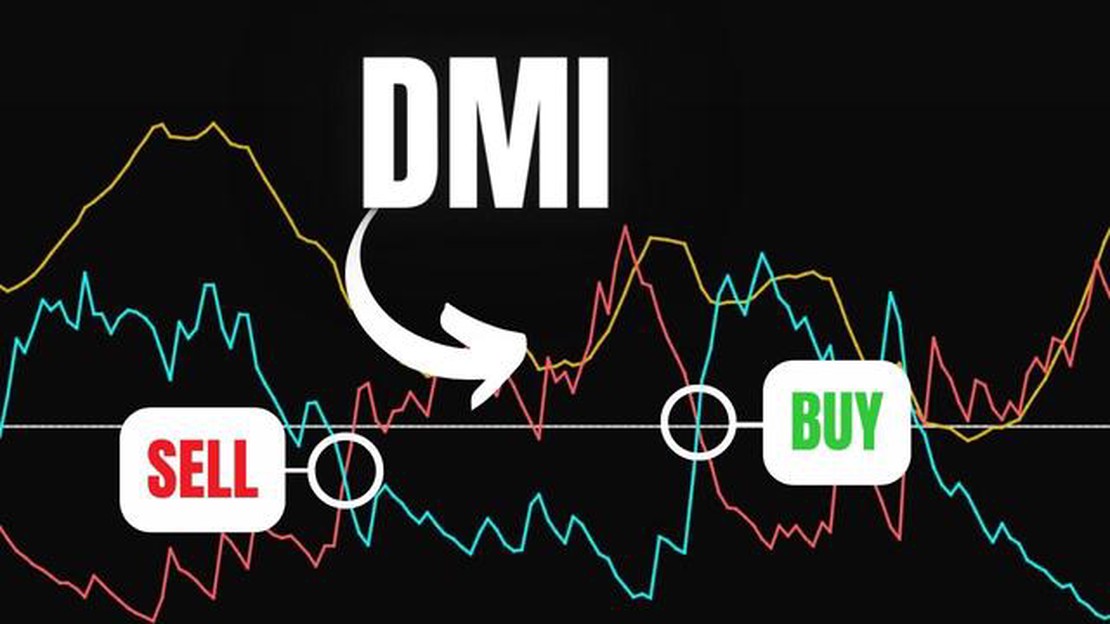
2. Positive Directional Indicator (+DI): The +DI measures the upward movement of price and can be used to determine bullish signals. When +DI crosses above the -DI (negative directional indicator), it signifies a potential bullish trend.
Read Also: Understanding Exponentially Smoothed Moving Average in Financial Analysis
3. Negative Directional Indicator (-DI): The -DI measures the downward movement of price and can be used to determine bearish signals. When -DI crosses above the +DI, it signifies a potential bearish trend.
Traders often use DMI indicators together to analyze market trends. By analyzing the combination of ADX, +DI, and -DI, traders can gain insights into the strength and direction of a trend, helping them make more informed trading decisions.
The DMI (Directional Movement Index) indicator is a technical analysis tool that helps traders identify the strength and direction of a trend in the price movement of an asset.

The DMI indicator is composed of two lines, the +DI (Positive Directional Indicator) and the -DI (Negative Directional Indicator). These lines measure the positive and negative movement in the price of an asset over a specific period of time. The DMI indicator then calculates the difference between the +DI and -DI to determine the strength and direction of the trend.
The DMI indicator has three key types: the Average Directional Index (ADX), the +DI line, and the -DI line. The ADX measures the strength of the trend, while the +DI and -DI lines indicate the direction of the trend.
The ADX is calculated by taking the average of the difference between the +DI and -DI lines over a specific period of time. The result is then smoothed using an exponential moving average to provide a more accurate measure of the trend strength.
The DMI indicator can be used to identify trends, confirm trend reversals, and generate trading signals. It can also help traders determine the strength of a trend and set appropriate stop-loss levels. Additionally, the DMI indicator can be used in conjunction with other technical analysis tools to improve trading decisions.
The DMI indicator, or the Directional Movement Index, is used to determine the strength and direction of a trend in the market.
The DMI indicator is calculated using a combination of the Average Directional Movement Index (ADX), the Plus Directional Indicator (+DI), and the Minus Directional Indicator (-DI).

Discover the Dow Jones Future Forecast The Dow Jones Future Forecast is an essential tool for investors and traders looking to stay ahead of the …
Read Article
Understanding the Difference Between a Slump and a Recession When it comes to economic downturns, terms like “slump” and “recession” are often used …
Read Article
Where and How to Purchase Iraqi Dinar: A Comprehensive Guide If you’re interested in expanding your investment portfolio, you may have come across the …
Read Article
Is the GTS still working on SoulSilver? When it comes to Pokemon SoulSilver, fans of the game may be wondering if the Global Trade Station (GTS) is …
Read Article
Understanding the Benefits of a Managed Futures Strategy Fund The Managed Futures Strategy Fund is an investment vehicle that offers investors …
Read Article
What does TAS stand for in trading? In the world of trading, there are many acronyms and terms that can confuse newcomers. One such acronym that is …
Read Article


