

Understanding the Square Position in Forex Trading: A Comprehensive Guide
Understanding Square in Forex Trading Forex trading is a complex and dynamic market that offers numerous opportunities for traders. One key aspect of …
Read Article
Technical analysis is a crucial skill for traders looking to make informed decisions in the financial markets. By analyzing historical price and volume data, traders can identify patterns and trends that can help them predict future price movements. In this step-by-step guide, we will walk you through the process of performing technical analysis in trading.
Step 1: Gather Data
The first step in technical analysis is to gather the necessary data. This includes historical price data, volume data, and any other relevant information that may impact the price of the asset you are analyzing. This data can be obtained from a variety of sources, including financial websites, trading platforms, and data providers.
Step 2: Choose a Charting Platform
Once you have gathered the required data, the next step is to choose a charting platform. There are many charting platforms available, both free and paid, that provide a wide range of tools and indicators for technical analysis. Some popular options include TradingView, MetaTrader, and Thinkorswim.
Step 3: Identify Trends and Patterns
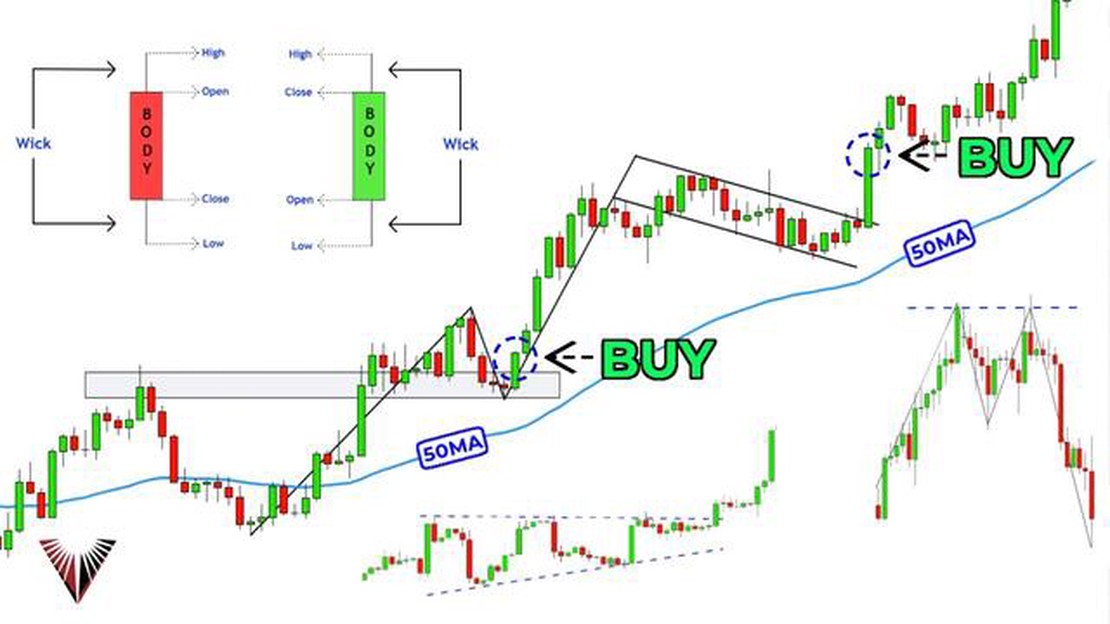
After selecting a charting platform, you can start analyzing the data to identify trends and patterns. This involves looking for price patterns like support and resistance levels, trendlines, and chart patterns such as triangles, head and shoulders, and double tops/bottoms. Additionally, you can use indicators like moving averages, oscillators, and volume indicators to further refine your analysis.
Step 4: Make Predictions
Based on your analysis, you can start making predictions about future price movements. This could involve forecasting the direction of the trend, setting price targets, or determining potential entry and exit points for trades. It is important to remember that technical analysis is not foolproof and should be used in conjunction with other forms of analysis and risk management techniques.
Step 5: Monitor and Adapt
Once you have made your predictions and executed trades based on your analysis, it is crucial to monitor the markets and adapt your strategy accordingly. Technical analysis is an ongoing process, and market conditions can change rapidly. By staying informed and continuously analyzing the data, you can adjust your trading strategy to maximize your chances of success.

Remember, mastering technical analysis takes time and practice. By following these steps and dedicating yourself to learning and improving, you can develop the skills necessary to become a successful trader.
When it comes to technical analysis in trading, having the right platform can make a significant difference in your success. A good platform will provide you with the necessary tools and features to effectively analyze market trends, make informed decisions, and execute trades.
Read Also: OctaFX App: Which Country is it From? All You Need to Know
Here are some factors to consider when choosing a platform for technical analysis:
Remember, the right platform for technical analysis will depend on your trading style, preferences, and needs. Take the time to research and try out different platforms before making a decision. Choosing the right platform can be a game-changer in your trading journey.
Technical analysis is a popular approach used in trading to help predict future price movements. It involves analyzing historical data, such as price and volume, to identify patterns and trends that can be used to make informed trading decisions. Technical analysis indicators play a crucial role in this process, as they provide traders with visual representations of the data and help them identify potential trading opportunities.
There are numerous technical analysis indicators available, each with its own unique purpose and interpretation. Here are some key indicators that traders commonly use:
1. Moving Averages:
Moving averages are one of the most widely used technical analysis indicators. They help smooth out price data and provide a clearer picture of the overall trend. The two main types of moving averages are the simple moving average (SMA) and the exponential moving average (EMA).
Read Also: Are stock options taxed as a bonus? Understanding the tax implications of stock options
2. Relative Strength Index (RSI):
The RSI is a momentum oscillator that measures the speed and change of price movements. It ranges from 0 to 100 and is used to identify overbought and oversold conditions in the market. A reading above 70 typically indicates an overbought condition, while a reading below 30 indicates an oversold condition.

3. Bollinger Bands:
Bollinger Bands are a volatility indicator that consists of an upper band, a middle band (usually a moving average), and a lower band. They are used to measure the volatility and potential price reversal points in the market. When the price moves towards the upper band, it may be a sign of an overbought condition, and when the price moves towards the lower band, it may be a sign of an oversold condition.
4. MACD (Moving Average Convergence Divergence):
MACD is a trend-following momentum indicator that shows the relationship between two moving averages of a security’s price. It consists of a MACD line, a signal line, and a histogram. Traders use the MACD to identify potential buy and sell signals and to gauge the strength of a trend.
5. Fibonacci Retracement:
Fibonacci retracement is a technical analysis tool used to identify potential support and resistance levels in the market. It is based on the Fibonacci sequence, where the key levels are drawn using horizontal lines at the Fibonacci ratios of 23.6%, 38.2%, 50%, 61.8%, and 100%.
These are just a few examples of the many technical analysis indicators available. Traders often use a combination of indicators to get a more comprehensive view of the market and increase their chances of making successful trades. It’s important to note that technical analysis indicators should not be used in isolation but should be used in conjunction with other factors, such as fundamental analysis and market sentiment, to make well-informed trading decisions.
Technical analysis in trading is a method of analyzing and predicting future price movements in the financial markets by studying historical data, such as price charts and trading volumes. It involves the use of various tools and indicators to identify patterns and trends in the market, with the aim of making profitable trading decisions.
Technical analysis is important in trading because it helps traders to make informed decisions based on historical price data and market trends. By using technical analysis, traders can identify potential entry and exit points, determine risk levels, and set realistic profit targets. It provides a systematic approach to analyzing the market, which can increase the probability of making profitable trades.
There are many technical analysis tools that traders use to analyze the market. Some of the commonly used tools include trend lines, support and resistance levels, moving averages, oscillators (such as the Relative Strength Index and Stochastic Oscillator), and chart patterns (such as head and shoulders, double top/bottom, and triangles). These tools help traders to identify potential buying and selling opportunities, as well as to determine the strength of a trend.

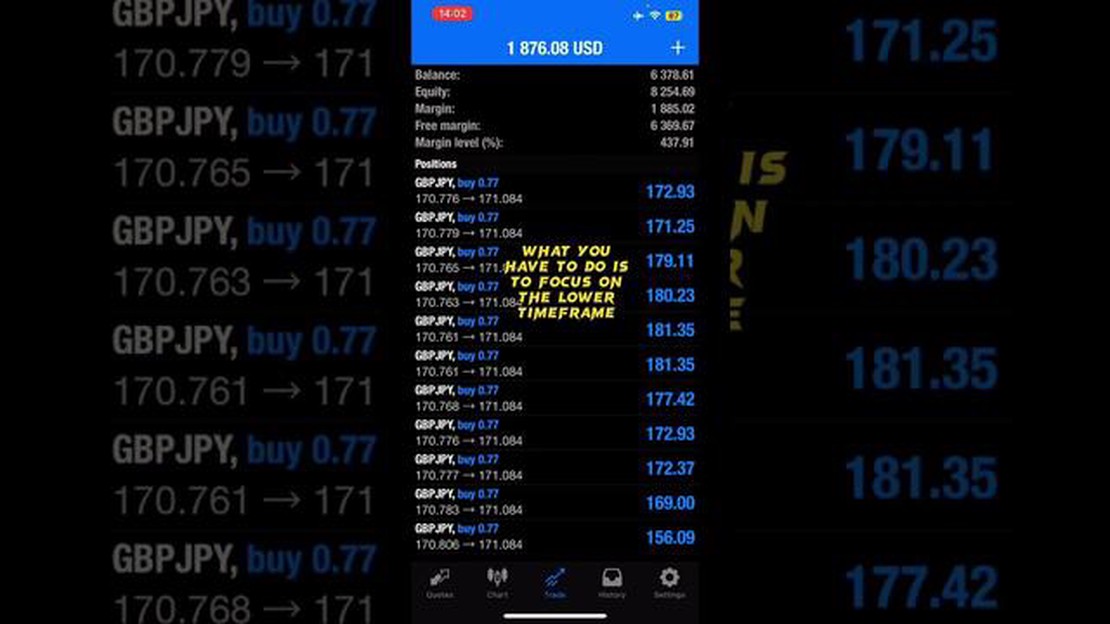
Understanding Square in Forex Trading Forex trading is a complex and dynamic market that offers numerous opportunities for traders. One key aspect of …
Read Article
Average Exchange Rate in Singapore When traveling to Singapore, it’s important to have a good understanding of the local currency and exchange rates. …
Read Article
Autobahn Futures and Options: Exploring the Benefits and Opportunities Autobahn futures and options are financial derivatives that allow investors to …
Read Article
How to Trade Options on Trade.com If you’re interested in expanding your investment portfolio and taking advantage of the potential profits that come …
Read Article
What is an example of selling a call option in the money? When it comes to options trading, one strategy that traders can employ is selling an …
Read Article
The Open Market Rate of CAD to PKR In today’s globalized world, currency exchange rates play a crucial role in international trade and finance. …
Read Article


