

Understanding the Standard Deviation of EMA: Explained in Simple Terms
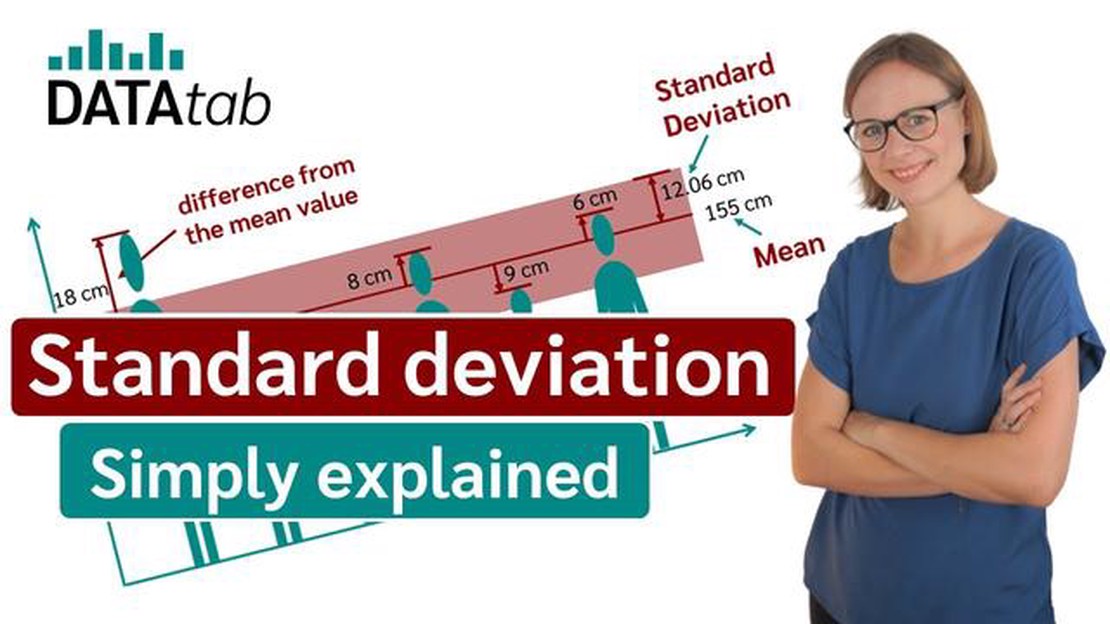
Understanding the standard deviation of EMA When it comes to analyzing financial data, the standard deviation is a widely used statistical measure. It …
Read Article

The exponentially smoothed moving average (ESMA) is a widely used technique in financial analysis. It is a statistical method that helps analysts identify trends and patterns in time series data, such as stock prices, sales figures, or economic indicators. By smoothing out the noise and capturing the underlying trend, ESMA provides a clearer picture of the data’s behavior.
ESMA differs from a simple moving average (SMA) in that it assigns more weight to recent data points and less weight to older data points. This makes it more responsive to changes in the data, allowing analysts to quickly identify shifts in the trend. The level of smoothing can be adjusted by changing the smoothing constant, which determines the weight assigned to each data point.
One of the key benefits of ESMA is its ability to reduce the impact of random fluctuations or outliers in the data. By giving more weight to recent data, ESMA can help filter out short-term noise, making it easier to identify long-term trends. This can be particularly useful in financial analysis, where noise and volatility are common.
In addition to trend identification, ESMA can also be used to forecast future data points. By extending the smoothing calculation into the future, analysts can generate predictions based on historical data. However, it’s important to note that ESMA is a lagging indicator, as it relies on past data. It should be used in conjunction with other analysis techniques to make informed decisions.
The Exponentially Smoothed Moving Average (ESMA) is a popular technical analysis tool used in financial analysis. It is a variant of the simple moving average (SMA) that provides a more responsive and smooth line of the average price over a specified time period.
ESMA gives more emphasis to recent data points while giving less importance to older data points. This is done by applying a smoothing factor or weight to each data point. The smoothing factor is typically represented by the symbol α (alpha) and is a value between 0 and 1.
The formula for calculating ESMA is:
ESMA = α * (Current Price - Previous ESMA) + Previous ESMA
Where:
The choice of the smoothing factor α depends on the analyst’s preference and the desired responsiveness of the moving average line. A smaller α value will result in a smoother line that is slower to react to price changes, while a larger α value will make the line more responsive but potentially more volatile.

ESMA is used by traders and investors to identify trends, determine support and resistance levels, and generate trading signals. It helps to eliminate noise from price fluctuations and provides a clearer picture of the underlying trend.
Read Also: Understanding Moving Average Investopedia: Definition, Calculation, and Application
It is important to note that ESMA is just one of many tools used in financial analysis, and its effectiveness can vary depending on the specific market conditions and the timeframe being analyzed.
The Exponentially Smoothed Moving Average (ESMA) is a popular method used in financial analysis to smooth out the fluctuations in a time series data. It is a type of moving average that assigns different weights to different data points, with more recent data being given higher weights.
ESMA calculates the smoothed average by multiplying each data point by a smoothing factor and summing them up. The smoothing factor, also known as the alpha value, determines the rate at which the weights decrease exponentially as you move further back in time.
The formula for calculating ESMA is:
ESMA = α * Current Value + (1 - α) * Previous ESMA
Where:
By adjusting the value of α, you can control the sensitivity of the ESMA to changes in the data. A smaller α value will result in a more responsive moving average, while a larger α value will result in a smoother moving average.
The ESMA is particularly useful in financial analysis because it can help identify trends and patterns in the data by filtering out short-term fluctuations. It is often used in technical analysis to generate trading signals and determine entry or exit points for investments.
Read Also: Is Binary Trading Legal in Bangladesh? The Complete Guide
Overall, the Exponentially Smoothed Moving Average is a powerful tool that provides a smoothed representation of time series data, allowing analysts to make more accurate forecasts and decisions based on historical data.

Exponentially Smoothed Moving Average (ESMA) is a valuable tool in financial analysis that offers several benefits to analysts and investors. It is widely used to analyze and predict trends in financial data, especially in stock market analysis.
Here are some key benefits of using the Exponentially Smoothed Moving Average:
Overall, Exponentially Smoothed Moving Average is a versatile and powerful tool that can significantly enhance financial analysis by providing valuable insights into trends, trend reversals, and potential price movements. It helps analysts make informed decisions and effectively manage risks in the dynamic world of finance.
An exponentially smoothed moving average is a statistical calculation that is used to analyze financial data. It is a type of moving average that assigns more weight to recent data points, giving them a greater influence on the overall average.
An exponentially smoothed moving average is calculated using a formula that takes into account the previous moving average value and the latest data point. The formula involves multiplying the previous moving average by a smoothing factor and adding the latest data point multiplied by one minus the smoothing factor.
The purpose of using an exponentially smoothed moving average in financial analysis is to smoothen out the fluctuations in the data and provide a clearer trend. It helps analysts to identify the direction and momentum of the financial data, making it easier to make informed decisions.
An exponentially smoothed moving average assigns more weight to recent data points, while a simple moving average gives equal weight to all data points. This means that an exponentially smoothed moving average reacts more quickly to changes in the data, making it more sensitive to recent trends.
Some advantages of using an exponentially smoothed moving average include its ability to provide a smoother trendline, its responsiveness to recent market changes, and its simplicity in calculation. It also avoids the lagging effect of a simple moving average, allowing for quicker analysis and decision-making.
The exponentially smoothed moving average (ESMA) is a statistical technique used in financial analysis to reduce the impact of random variations and noise in time series data. It assigns a larger weight to more recent observations and gradually decreases the weight of older observations.

Understanding the standard deviation of EMA When it comes to analyzing financial data, the standard deviation is a widely used statistical measure. It …
Read Article
Are binary options taxable? - The truth about taxes on binary options Binary options trading has gained significant popularity in recent years as a …
Read Article
Understanding the Meaning of Blue in Forex Trading Forex, or foreign exchange, has become one of the most lucrative markets in the world. Traders and …
Read Article
What is the difference between ARIMA and VARMA? In the field of time series analysis, two commonly used models for forecasting and understanding the …
Read Article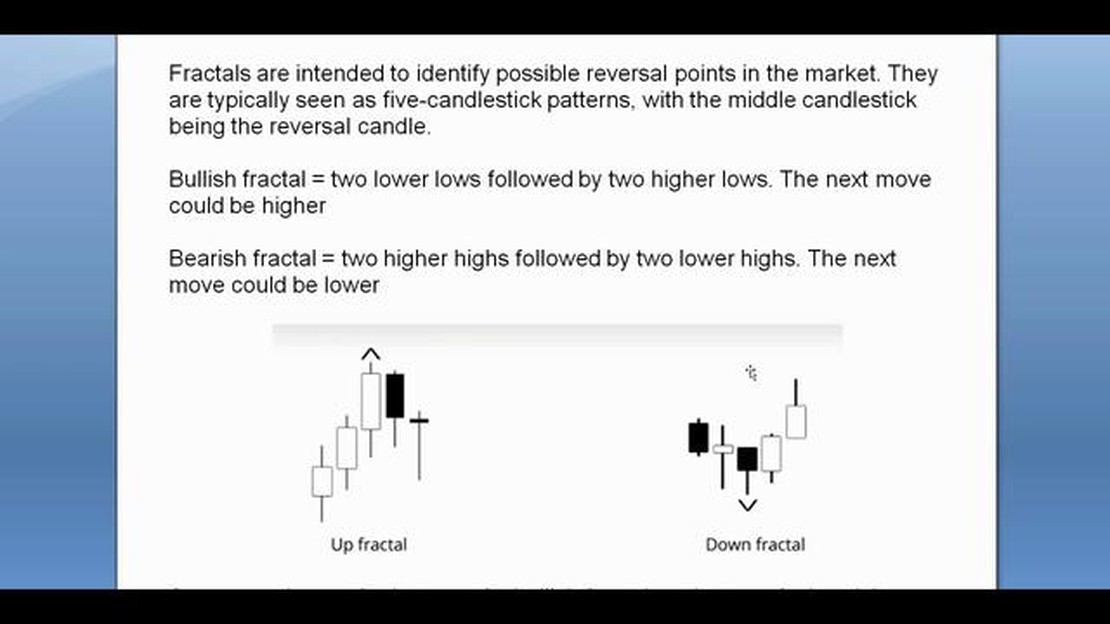
Are Fractals a Reliable Indicator? Fractals have long been hailed as a powerful tool for predicting market trends and identifying key support and …
Read Article
How much is $1000 American Express? American Express is one of the leading financial services companies in the world. It offers a wide range of credit …
Read Article


