


Is Forex Trading Legal in India in 2023? Exploring the Current Regulations
Is forex trading Legal in India 2023? Forex trading, the global decentralized market for the trading of currencies, has gained significant popularity …
Read Article
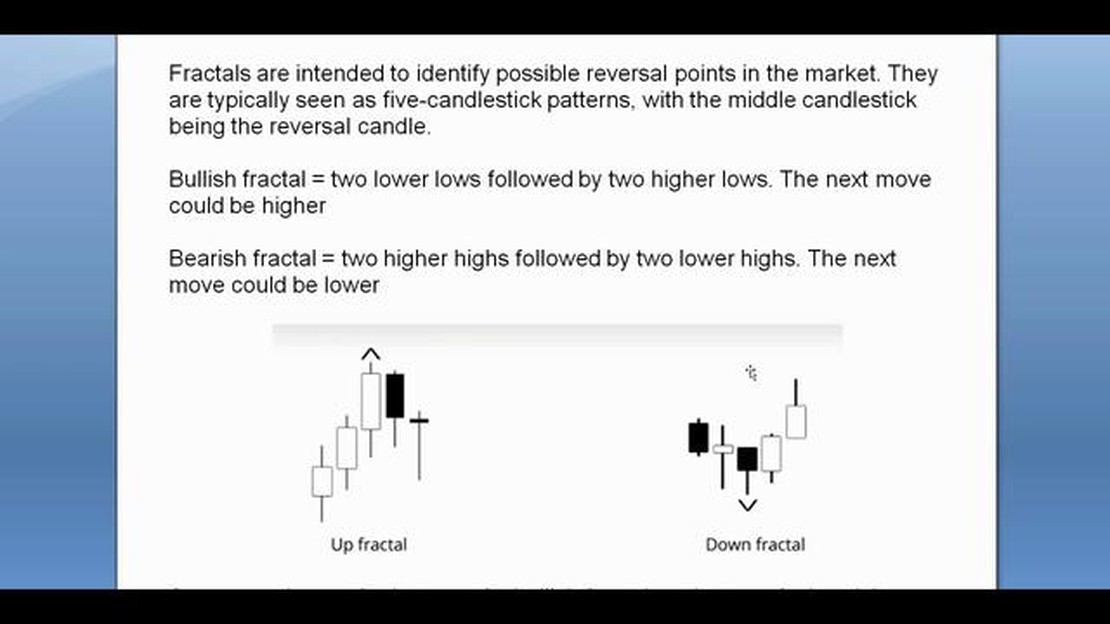
Fractals have long been hailed as a powerful tool for predicting market trends and identifying key support and resistance levels. These intricate mathematical patterns are lauded for their ability to capture the underlying structure of price movement, allowing traders to make informed decisions based on the repetitive nature of market behavior.
However, the reliability of fractals as indicators has been a subject of debate among traders and analysts. While some argue that fractals offer invaluable insights into market dynamics, others are skeptical of their predictive power and question their practicality in real-time trading.
This article aims to provide a comprehensive analysis of the effectiveness of fractals as indicators. We will examine various factors that affect the reliability of fractals, including market conditions, timeframe, and the interpretation of fractal signals.
By evaluating the strengths and limitations of fractal analysis, traders can make informed decisions about incorporating fractals into their trading strategies. Whether fractals can indeed serve as reliable indicators remains open to interpretation and requires a nuanced understanding of their application in different market scenarios.
Disclaimer: The views and opinions expressed in this article are solely those of the author and do not constitute financial advice. Trading in financial markets involves risk and may not be suitable for all investors. Always conduct your own research and consult with a licensed financial advisor before making any investment decisions.
Fractals are mathematical patterns that can be found in various natural and man-made phenomena. In recent years, there has been growing interest in using fractals as indicators in financial markets. The idea behind this approach is that fractal patterns can provide insights into the behavior of markets and help predict future price movements.

However, the reliability of fractal indicators in financial analysis is a matter of debate. While some traders and analysts believe that fractals can be highly accurate predictors of market trends, others argue that their usefulness is limited and that they often provide false signals.
Proponents of fractals as indicators point to their self-similarity and repetitive nature as evidence of their predictive power. They argue that fractal patterns can be used to identify potential support and resistance levels, as well as to determine trend reversals and breakouts. By analyzing the fractal structure of price charts, traders can gain a better understanding of market dynamics and make more informed trading decisions.
On the other hand, critics argue that the fractal nature of financial markets is not always clear-cut and that patterns can easily be misinterpreted or overestimated. They point out that fractals are based on historical price data and do not take into account other relevant factors, such as market fundamentals or investor sentiment. As a result, relying solely on fractal indicators may lead to inaccurate predictions and financial losses.
It is important to note that the reliability of fractal indicators depends on various factors, including the time frame and the specific market being analyzed. Fractals may work better in certain market conditions or for certain types of assets, while being less effective in others. Additionally, the use of fractal indicators should be complemented with other technical and fundamental analyses to ensure a more comprehensive understanding of market trends.
In conclusion, the reliability of fractals as indicators in financial analysis is a controversial topic. While some traders find them to be valuable tools for predicting market trends, others are more skeptical of their usefulness. Ultimately, the decision to use fractal indicators should be based on careful evaluation of their strengths and limitations, as well as on the specific requirements and characteristics of the market in question.
Read Also: How to Write an Expert Advisor (EA) in Forex? Step-by-Step Guide
Advantages:
Disadvantages:
Overall, while fractals can be a valuable tool in technical analysis, traders should use them in conjunction with other indicators and market analysis to make informed trading decisions.
Fractals have gained significant attention as potential indicators in various fields, including finance, physics, and computer science. These complex mathematical patterns have been studied extensively to determine their reliability as indicators for predicting market trends, analyzing natural phenomena, and generating computer-generated graphics.
Read Also: The 5 Crucial Elements of International Trade: Explained
One area where fractals have been extensively explored is in financial markets. Traders and analysts have utilized fractals to identify potential reversal points, trend continuation, and overall market dynamics. The self-similarity property of fractals allows traders to identify key levels of support and resistance, helping them make informed decisions in their trading strategies.
However, while fractals offer a unique perspective on market patterns, their reliability as indicators remains a topic of debate among analysts. Some argue that fractals provide valuable insight into market behavior and can be used as a reliable tool for predicting future price movements. They believe that the repetitive nature of fractals reflects the inherent cyclical nature of financial markets.
On the other hand, critics argue that the subjective nature of identifying and interpreting fractal patterns limits their usefulness as indicators. They argue that different analysts may identify different patterns based on their interpretation, leading to subjective and inconsistent conclusions. Additionally, they claim that fractal analysis alone may not be sufficient to generate accurate predictions, as it overlooks other essential factors such as fundamental analysis and market sentiment.
To determine the reliability of fractals as indicators, extensive research and comprehensive analysis are required. This involves testing various fractal-based strategies and comparing their performance against benchmark indicators. It also involves evaluating the consistency and accuracy of fractal patterns across different timeframes and market conditions.
Overall, while fractals offer a fascinating perspective on market dynamics, their reliability as indicators is still being explored. Further research and analysis are needed to fully understand their potential and limitations in different domains. It is essential to consider fractals in conjunction with other indicators and factors to make well-informed decisions and mitigate the risks associated with trading and other applications.

Fractals can be used as indicators for trading, but their reliability depends on various factors such as the timeframe, market conditions, and the trading strategy being used.
Fractals work as indicators in trading by identifying recurring patterns in price movements. They can help traders spot potential trend reversals and key levels of support and resistance.
Fractals can be more reliable in certain market conditions such as trending markets, where they can help traders identify potential entry and exit points. However, in ranging or choppy markets, fractals may not provide as reliable signals.
Some limitations of using fractals as indicators include their sensitivity to market noise, the subjectivity in defining what constitutes a valid fractal, and the lack of effectiveness in certain market conditions. Traders should also be cautious of over-reliance on fractals alone and should consider using them in conjunction with other technical analysis tools.
Yes, fractals can be used in combination with other indicators to enhance trading signals and confirm potential trend reversals or breakout points. Commonly used indicators in conjunction with fractals include moving averages, trend lines, and oscillators.

Is forex trading Legal in India 2023? Forex trading, the global decentralized market for the trading of currencies, has gained significant popularity …
Read Article
Latest Version of Windows Phone Windows Phone, developed by Microsoft, was a mobile operating system that was first released in 2010. Over the years, …
Read Article
How Long Does it Take to Master Forex Trading? Forex trading is a complex and dynamic field that requires extensive knowledge and experience to …
Read Article
How to Forecast a Trendline? Forecasting is a critical task for any business looking to plan for the future. Without accurate forecasts, businesses …
Read Article
What is intraday option? Day trading is a popular and exciting form of trading where traders buy and sell financial instruments within the same …
Read Article
Can you withdraw money from Expert Option? Expert Option is a popular online trading platform that allows users to trade various financial assets, …
Read Article


