


Can US Clients Trade with City Index? Frequently Asked Questions
Does City Index accept US clients? City Index is a well-known brokerage firm that offers a wide range of trading services to clients around the world. …
Read Article
In the world of finance and economics, one of the most common tools used to analyze trends in data is the moving average rate. This statistical concept allows us to smooth out fluctuations and better understand the overall direction of a particular data set. One specific type of moving average rate that is frequently used is the 12 month moving average rate.
So, what exactly is the 12 month moving average rate? This term refers to the average rate of a particular variable, such as the stock price or interest rate, over the course of a year. By calculating the average rate over a longer time period, we are able to get a clearer picture of the overall trend and eliminate any short-term noise or volatility in the data.
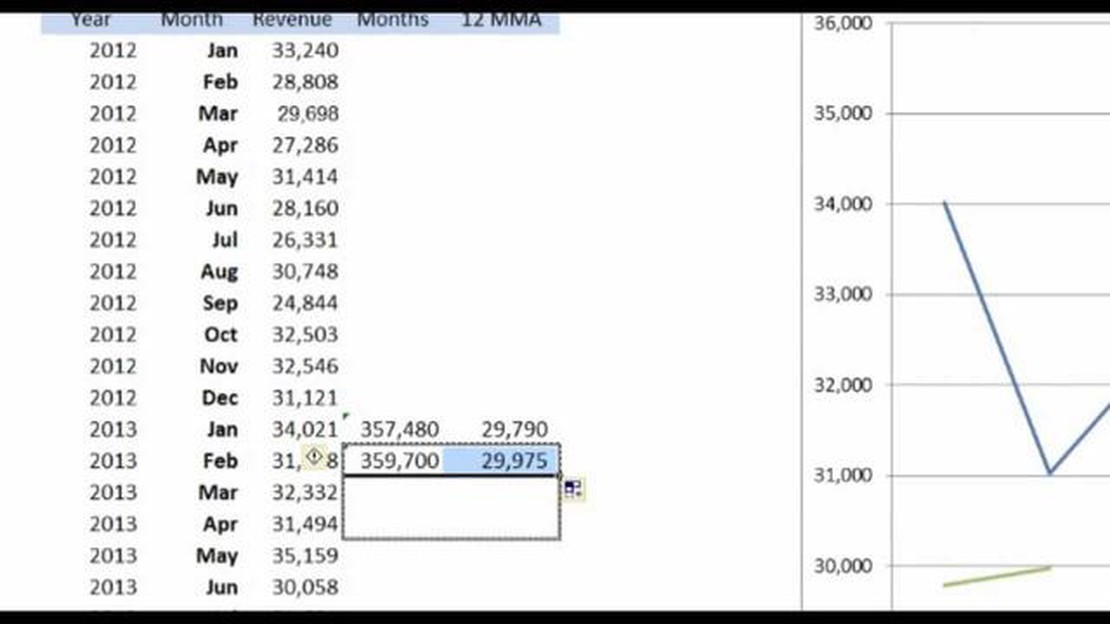
To calculate the 12 month moving average rate, we take the average of the variable over the past 12 months. As each month passes, we drop off the oldest data point and add in the newest one. This allows us to constantly update the moving average rate, ensuring that we are always working with the most recent data.
For example, let’s say we were calculating the 12 month moving average rate of a company’s stock price. In January, we would take the average of the stock prices from February of the previous year to January of the current year. In February, we would drop off February of the previous year and add in the stock price from February of the current year. This process continues each month, giving us a rolling average of the stock price over the past year.
The 12 month moving average rate can be a valuable tool for investors and analysts alike. It helps us identify long-term trends, filter out short-term noise, and make more informed decisions based on the overall direction of the data. Whether it’s tracking stock prices, interest rates, or any other variable, understanding the concept of the 12 month moving average rate is essential for anyone working with financial data.
The 12 month moving average rate is a crucial metric in many financial analyses and forecasting models. It provides a smoothed representation of a variable’s trend by taking into account data from the past year. This longer period allows for a more accurate depiction of the variable’s overall behavior, filtering out shorter-term fluctuations and noise.

By using the 12 month moving average rate, analysts and investors are able to gain valuable insights into the underlying momentum and direction of a particular variable, such as stock prices, sales figures, or interest rates. It enables them to identify long-term trends, patterns, and cycles that may not be apparent in raw data or shorter time frames.
One of the key benefits of using the 12 month moving average rate is its ability to smooth out seasonal variations and random fluctuations. It helps to remove the effect of short-term anomalies, making it easier to identify the true underlying trend. This is particularly useful in economic and financial analysis, where seasonality and random effects can obscure the actual patterns and make it more challenging to accurately predict future behavior.
Moreover, the 12 month moving average rate provides a more stable and reliable estimate of a variable’s average value over time. This is advantageous for decision-making processes, such as setting budget targets or forecasting future performance. It helps reduce the impact of outliers and extreme values, providing a more realistic and representative picture of the variable’s behavior.
Overall, understanding the importance of the 12 month moving average rate is essential for anyone involved in financial analysis or forecasting. It allows for a more accurate and reliable assessment of a variable’s trend and behavior, enabling better decision-making and prediction capabilities. By providing a smoothed representation of data over a longer time period, the 12 month moving average rate helps uncover hidden patterns and trends that may be missed in shorter time frames, leading to more informed and effective decision-making.
Read Also: Understanding the Black-Scholes Model for ESOP: A Comprehensive Guide
The 12 Month Moving Average Rate is a financial metric used to analyze and interpret market trends. It is calculated by taking the average value of a specific variable over a 12-month period. This moving average is commonly used in finance and economics to smooth out short-term fluctuations and to identify long-term trends.
The 12 Month Moving Average Rate is particularly useful for analyzing data that exhibits seasonality or volatility. By calculating the average over a longer period of time, it provides a more accurate representation of the underlying trend.
For example, if you are tracking the sales of a particular product, you can calculate the 12 Month Moving Average Rate to understand the average sales over the past year. This can help you identify whether sales are increasing, decreasing, or remaining relatively stable.
Furthermore, the 12 Month Moving Average Rate can be used to make predictions and forecasts about future trends. By analyzing the historical data and the current moving average, you can make informed decisions about potential future outcomes.
It is important to note that the 12 Month Moving Average Rate is just one of many tools used in financial analysis. It should be used in conjunction with other metrics and indicators to get a comprehensive understanding of the market conditions.
In conclusion, the 12 Month Moving Average Rate is a valuable tool for analyzing and interpreting market trends. It provides a smoothed representation of the data and can be used to identify long-term patterns and make informed predictions about the future.
Read Also: Is the GTS still functional on Pokemon SoulSilver?
The 12 Month Moving Average Rate is an important measure that helps investors understand the overall trend of a particular market or investment over a longer period of time. It is calculated by adding up the averages of a specified number of periods, typically 12, and dividing by the number of periods.
There are several reasons why the 12 Month Moving Average Rate is important:
By understanding and monitoring the 12 Month Moving Average Rate, investors can gain valuable insights into the market and make more informed decisions. It is a powerful tool that can help investors identify trends, determine support and resistance levels, confirm other indicators, and make long-term investment decisions.
A 12 month moving average rate is a measure used by economists and analysts to smoothen out the fluctuations in a data series over a year. It is calculated by taking the average of the data points in the series over the past 12 months, and updating it monthly as new data becomes available.

A 12 month moving average rate is important because it helps in identifying trends and patterns in a data series while filtering out short-term noise and volatility. It provides a more accurate representation of the underlying data, making it easier to analyze and make predictions.
To calculate a 12 month moving average rate, you need to sum up the data points in the series for the past 12 months and divide it by 12. Then, as new data becomes available, you replace the oldest data point in the series with the new one and recalculate the average.
The advantages of using a 12 month moving average rate are that it helps in smoothing out short-term fluctuations, making it easier to identify long-term trends. It reduces the effect of outliers and improves the accuracy of analysis and predictions.
A 12 month moving average rate can be used for various types of data series, including financial data, economic indicators, stock prices, and weather data, among others. However, its applicability may vary depending on the nature of the data and the specific analysis being performed.

Does City Index accept US clients? City Index is a well-known brokerage firm that offers a wide range of trading services to clients around the world. …
Read Article
Was Dwight Howard ever MVP? Dwight Howard is one of the most dominant players in the history of the NBA. Throughout his career, he has achieved …
Read Article
Which type of trading is most profitable? Trading in financial markets can be a lucrative endeavor, but with so many different types of trading …
Read Article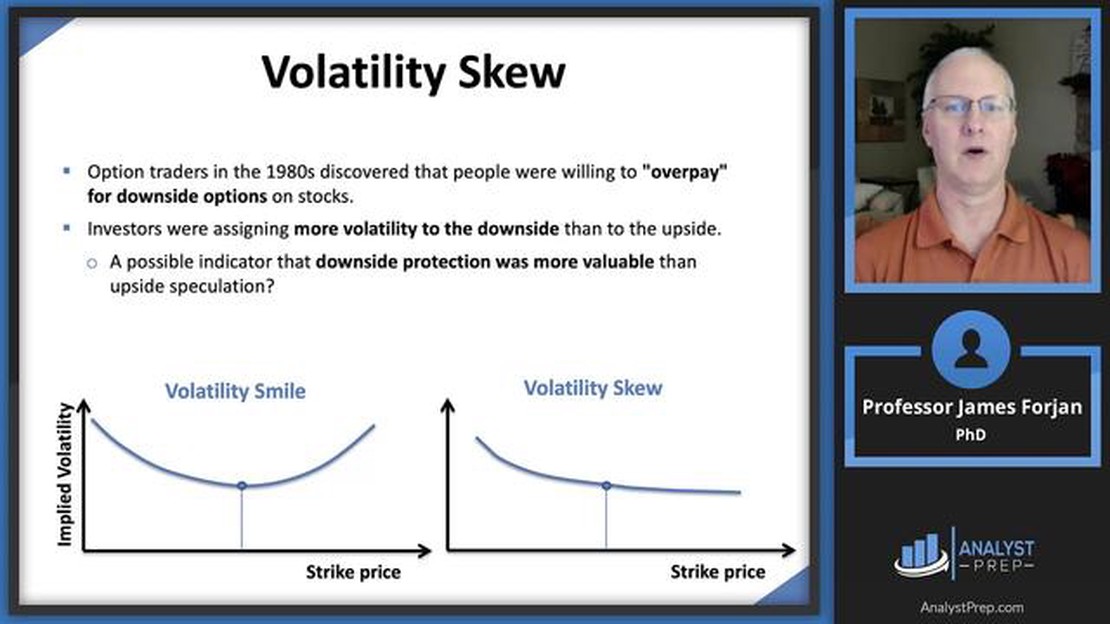
Understanding the Volatility Skew Smile Options trading is a complex financial practice that requires a deep understanding of various market factors. …
Read Article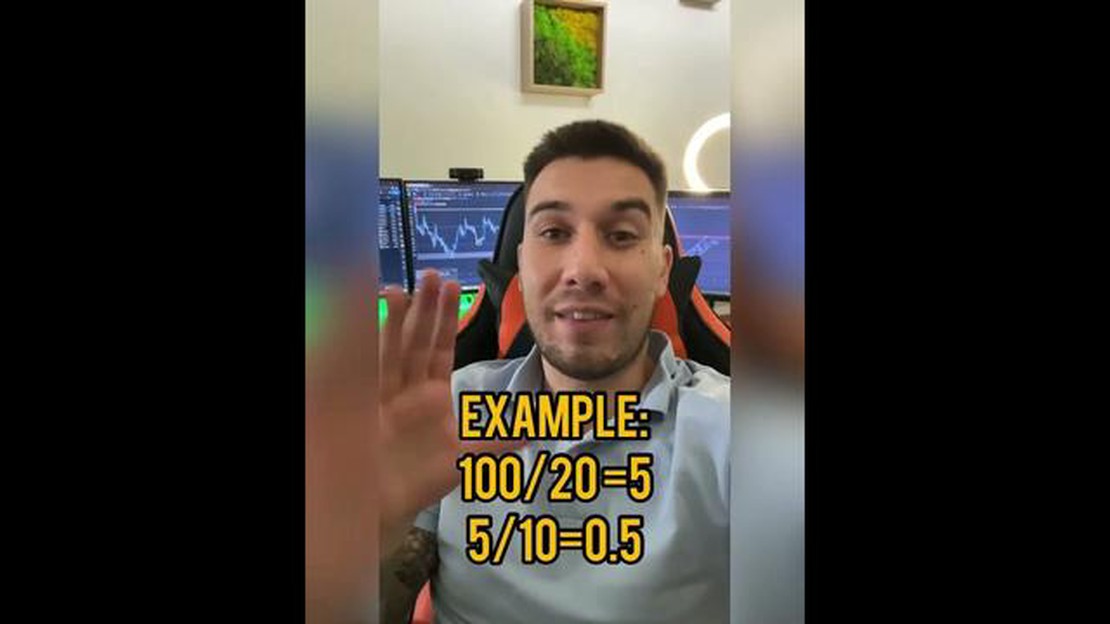
Calculating the Number of Lots for $1000 in Forex When it comes to forex trading, understanding the concept of lots is essential. A lot refers to the …
Read Article
What does RT stand for? The acronym “RT” is widely used in various contexts, but its meaning can vary depending on the industry or field. RT is an …
Read Article


