
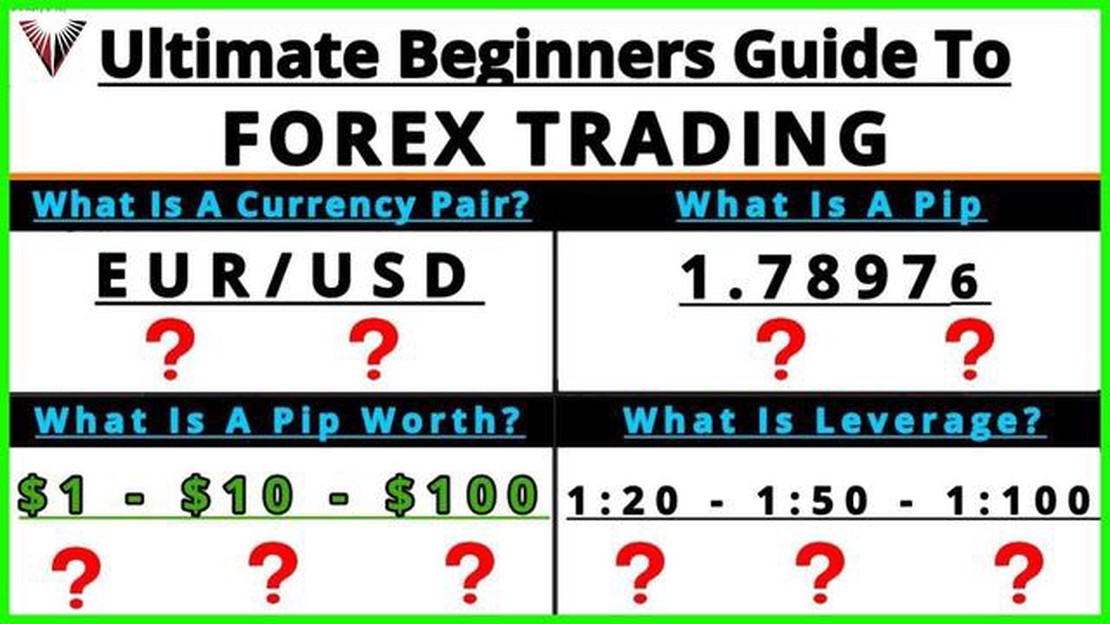

Mastering Currency Trading Online: Tips and Tricks for Success
Guide to Trading Currency Online If you have ever considered delving into the world of currency trading, you are not alone. With the rise of online …
Read Article
The candlestick theory is a powerful tool used by traders to analyze and predict market movements. Dating back to the 18th century, this Japanese technique has stood the test of time and remains a key element in technical analysis. The theory is based on the idea that price movements can be represented by candlestick patterns, each with its own significance and predictive value.
At its core, the candlestick theory is built on the principle that market psychology is reflected in price movements. By studying these movements and the patterns they create, traders can gain insight into the balance of power between buyers and sellers. This information can then be used to make more informed trading decisions.
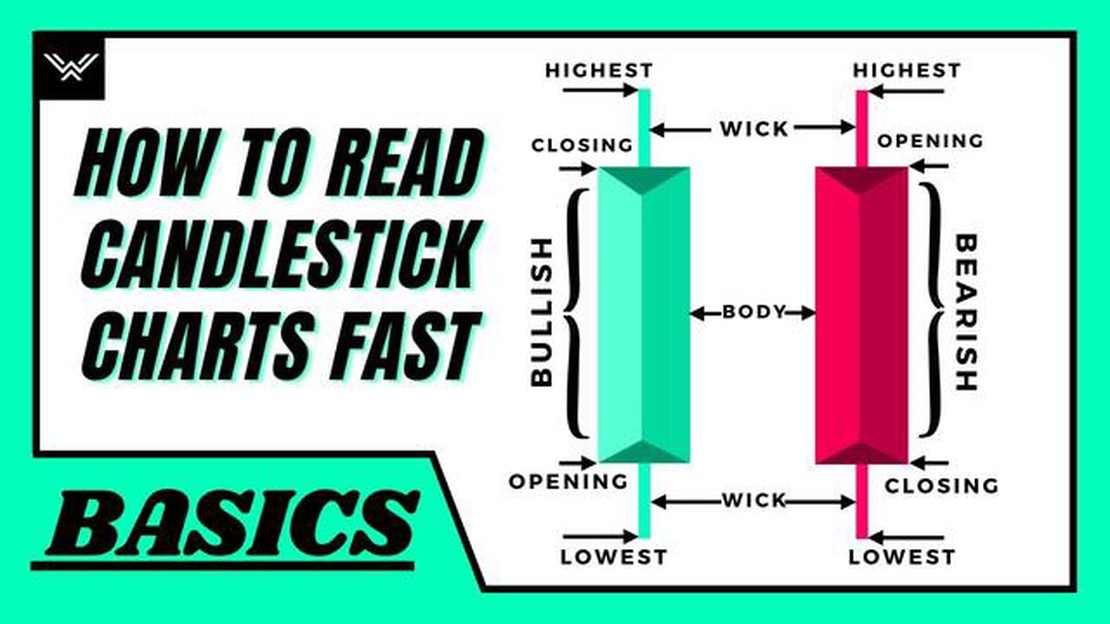
The beauty of the candlestick theory lies in its simplicity and visual nature. Each candlestick represents a specific time period, with the body of the candle showing the opening and closing prices, and the wicks or shadows indicating the high and low prices. By observing the different shapes and formations of these candlesticks, traders can identify trends, reversals, and other important market signals.
One of the most well-known and widely used candlestick patterns is the “doji.” This pattern represents indecision in the market, where the opening and closing prices are very close or even the same. Traders interpret this pattern as a potential reversal signal, as it indicates a shift in sentiment and a possible change in direction.
It is important to note that the candlestick theory is not foolproof and should be used in conjunction with other technical indicators and analysis methods. However, by mastering the art of candlestick interpretation, traders can enhance their ability to spot potential trading opportunities and improve their overall trading performance.
The history of candlestick charts dates back to 18th century Japan, where they were first used by Japanese rice traders. These traders used candlestick charts to analyze and predict price movements in the rice market.
Candlestick charts were created to visually represent the price range and fluctuations of rice over a given time period. The design of the candlesticks allowed traders to easily see the relationship between the opening, closing, high, and low prices of rice.
The candlestick patterns and formations were developed over time to help traders identify potential reversals and continuations in price trends. Japanese rice traders observed that certain candlestick patterns tended to precede specific price movements, which provided valuable insights for making trading decisions.
In the 1980s, Steve Nison introduced candlestick charts to the Western world in his book “Japanese Candlestick Charting Techniques”. Since then, candlestick charts have gained popularity among traders and investors worldwide due to their ability to provide clear and concise visual representations of price action.
Today, candlestick charts are widely used across various financial markets, including stocks, futures, forex, and cryptocurrencies. Traders and analysts rely on candlestick patterns and formations to make informed trading decisions and identify potential opportunities in the market.
When it comes to understanding candlestick patterns, it’s important to start with the basics. These patterns provide valuable information about the market sentiment and can help traders make informed decisions. Here are some of the most common and important candlestick patterns:
 5. Bearish Engulfing: A bearish engulfing pattern occurs when a small bullish candlestick is followed by a larger bearish candlestick. It suggests a potential reversal from an uptrend to a downtrend.
Read Also: What is the opposite of a rally in forex? Exploring the inverse movement in currency markets6. Three White Soldiers: This pattern is formed by three consecutive long bullish candlesticks with small or no shadows. It indicates a strong uptrend and suggests continued upward movement. 7. Three Black Crows: This pattern is formed by three consecutive long bearish candlesticks with small or no shadows. It indicates a strong downtrend and suggests continued downward movement.
These are just a few of the basic candlestick patterns that traders should be familiar with. By understanding these patterns and their implications, traders can improve their decision-making and increase their chances of success in the market.
Candlestick patterns are essential tools for traders to analyze and predict market movements. While basic candlestick patterns like doji and hammer are widely known, there is a range of advanced candlestick patterns that can provide further insights into market behavior. These patterns are formed by multiple candlesticks and can offer more reliable signals for traders.
Read Also: What is Merrill Edge's minimum required investment?5. Bullish Harami Pattern: This pattern consists of a large bearish candlestick followed by a smaller bullish candlestick that is completely engulfed by the previous candlestick’s body. It indicates a potential reversal from a downtrend to an uptrend.
 6. Bearish Harami Pattern: This pattern is the opposite of the bullish harami. It occurs when a large bullish candlestick is followed by a smaller bearish candlestick that is engulfed by the previous candlestick’s body. It suggests a potential reversal from an uptrend to a downtrend.
7. Three White Soldiers and Three Black Crows:
8. Three White Soldiers: This pattern is formed by three consecutive long bullish candlesticks with each candlestick’s close higher than the previous one. It signifies a strong uptrend and indicates that buyers are in control.
9. Three Black Crows: Conversely, this pattern is formed by three consecutive long bearish candlesticks with each candlestick’s close lower than the previous one. It suggests a strong downtrend and indicates that sellers are dominating the market.
10. Evening Star and Morning Star:
11. Evening Star: This pattern occurs during an uptrend and consists of three candlesticks. The first candlestick is bullish, followed by a small-bodied candlestick with a gap between the first and third candlesticks. The third candlestick is bearish and engulfs the body of the first candlestick. This pattern suggests a potential reversal from an uptrend to a downtrend.
12. Morning Star: This pattern is the opposite of the evening star and occurs during a downtrend. It also consists of three candlesticks. The first candlestick is bearish, followed by a small-bodied candlestick with a gap. The third candlestick is bullish and engulfs the body of the first candlestick. It indicates a possible reversal from a downtrend to an uptrend.
6. Bearish Harami Pattern: This pattern is the opposite of the bullish harami. It occurs when a large bullish candlestick is followed by a smaller bearish candlestick that is engulfed by the previous candlestick’s body. It suggests a potential reversal from an uptrend to a downtrend.
7. Three White Soldiers and Three Black Crows:
8. Three White Soldiers: This pattern is formed by three consecutive long bullish candlesticks with each candlestick’s close higher than the previous one. It signifies a strong uptrend and indicates that buyers are in control.
9. Three Black Crows: Conversely, this pattern is formed by three consecutive long bearish candlesticks with each candlestick’s close lower than the previous one. It suggests a strong downtrend and indicates that sellers are dominating the market.
10. Evening Star and Morning Star:
11. Evening Star: This pattern occurs during an uptrend and consists of three candlesticks. The first candlestick is bullish, followed by a small-bodied candlestick with a gap between the first and third candlesticks. The third candlestick is bearish and engulfs the body of the first candlestick. This pattern suggests a potential reversal from an uptrend to a downtrend.
12. Morning Star: This pattern is the opposite of the evening star and occurs during a downtrend. It also consists of three candlesticks. The first candlestick is bearish, followed by a small-bodied candlestick with a gap. The third candlestick is bullish and engulfs the body of the first candlestick. It indicates a possible reversal from a downtrend to an uptrend.
These advanced candlestick patterns can provide valuable insights into market sentiment and help traders make informed decisions. It is important to combine these patterns with other technical analysis tools and indicators for more accurate predictions.
The candlestick theory is a charting technique used in technical analysis to predict price movements of financial assets. It originated in Japan and became popular in the Western world in the 1990s. It involves analyzing candlestick patterns and using them to make predictions about future price movements.
The candlestick theory works by analyzing the open, high, low, and close prices of a financial asset over a specific period of time. Each period is represented by a candlestick, which has a body and sometimes wicks or shadows. By studying patterns formed by these candlesticks, traders can gain insights into the market sentiment and make predictions about future price movements.
Some common candlestick patterns include doji, hammer, shooting star, engulfing, and harami. Doji represents indecision in the market, hammer is a bullish reversal pattern, shooting star is a bearish reversal pattern, engulfing is a trend reversal pattern, and harami is a pattern where a small candle is contained within the body of a larger candle.
Yes, the candlestick theory can be used for any financial asset, such as stocks, commodities, forex, and cryptocurrencies. The principles of analyzing candlestick patterns and making predictions about price movements apply to all types of financial markets.
The candlestick theory is a widely used and respected charting technique in technical analysis. While it does not guarantee accurate predictions, it provides traders with valuable insights into market sentiment and can be used in conjunction with other technical indicators to make more informed trading decisions.
The Candlestick Theory is a method used in technical analysis to predict future price movements of an asset based on past price patterns. It involves the use of candlestick charts, which display the open, high, low, and close prices of an asset over a specific time period.

Guide to Trading Currency Online If you have ever considered delving into the world of currency trading, you are not alone. With the rise of online …
Read Article
Is it Possible to Day Trade 3 Times a Week? Day trading is a popular form of trading where traders open and close positions within the same day to …
Read Article
Opening an Islamic Account for Forex Trading: Everything You Need to Know Forex trading is a popular investment option for individuals looking to make …
Read Article
Are binary options legal? Binary options have gained popularity in recent years as a simple and quick way to trade financial markets. However, their …
Read Article
Understanding the Concept of 200-Day Moving Average The 200-day moving average is a popular technical indicator used by traders and investors to …
Read Article
Exchange foreign currency at SBI If you are planning to travel abroad or have recently returned from a foreign trip, you may be wondering if you can …
Read Article


