


Is Forex Trading Good? Pros and Cons of Forex Trading
Is Forex Trading a Good Investment Option? Forex trading, also known as foreign exchange trading or currency trading, is the buying and selling of …
Read Article
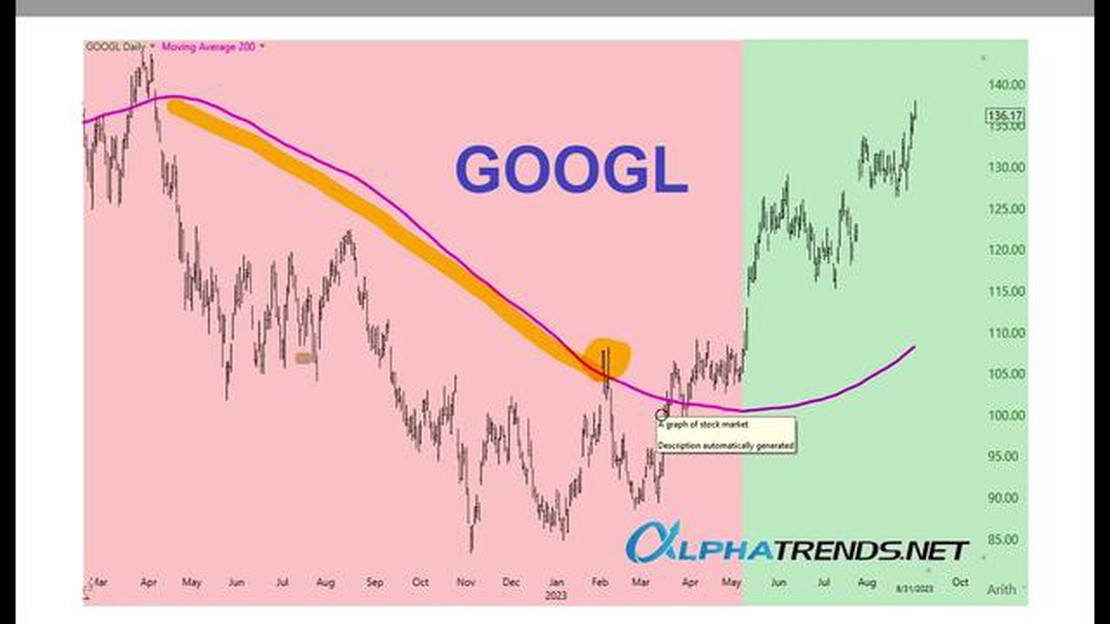
The 200-day moving average is a popular technical indicator used by traders and investors to analyze and predict price trends in the financial markets. It is a simple calculation that provides a smoothed line representing the average price of a security over the past 200 trading days.
The 200-day moving average is commonly used in stock trading, but it can also be applied to other financial instruments such as currencies, commodities, and indices. By plotting the 200-day moving average on a chart, traders are able to identify trends and potential support or resistance levels.
Traders and investors use the 200-day moving average in various ways. One common strategy is to observe the relationship between the security’s current price and the 200-day moving average. If the price is consistently above the moving average, it can be interpreted as a bullish signal, indicating that the security is in an uptrend. Conversely, if the price consistently falls below the 200-day moving average, it may indicate a bearish trend.

Another strategy is to look for potential buying or selling opportunities when the price crosses above or below the 200-day moving average. This is known as a moving average crossover, and it can provide traders with entry or exit signals. For example, a bullish crossover occurs when the price moves above the 200-day moving average, signaling a potential buying opportunity. On the other hand, a bearish crossover happens when the price falls below the 200-day moving average, indicating a possible selling opportunity.
It is important to note that the 200-day moving average is not foolproof and should be used in conjunction with other technical indicators and analysis methods. Traders and investors should consider market conditions, volume, and other factors before making trading decisions based solely on the 200-day moving average. Additionally, it is essential to regularly monitor and update the moving average as new data becomes available to ensure its accuracy and relevance.
In conclusion, the 200-day moving average is a valuable tool that can aid traders and investors in understanding price trends and making informed trading decisions. By using this indicator, market participants can potentially identify opportunities and manage risk more effectively in the financial markets.
The 200-day moving average is a technical indicator used by traders and investors to analyze the overall trend of a security or market. It is calculated by averaging the closing prices of a security over the past 200 trading days and plotting the data on a chart. The 200-day moving average is commonly used to identify key support and resistance levels, as well as to determine the overall direction of a security’s price movement.
The 200-day moving average is considered a long-term trend indicator, as it takes into account a significant amount of historical price data. This helps to smooth out short-term fluctuations and noise, allowing traders to focus on the overall trend of a security. By looking at the relationship between a security’s current price and its 200-day moving average, traders can gain insights into whether the security is in an uptrend or downtrend.
Read Also: Understanding the Distinction: Whole Loan Sale vs. Securitization
When a security’s price is trading above its 200-day moving average, it is generally considered to be in an uptrend, indicating that the overall sentiment in the market is bullish. Many traders use this as a signal to enter or hold onto a long position in the security, as they believe that the upward momentum is likely to continue. On the other hand, when a security’s price falls below its 200-day moving average, it is often seen as a bearish signal, suggesting that the overall trend is downwards. Traders may use this as a signal to exit or avoid a long position in the security.
It is important to note that the 200-day moving average is not a foolproof indicator and should not be relied upon solely for making trading decisions. Like any technical indicator, it has its limitations and can produce false signals. Therefore, it is recommended to use the 200-day moving average in conjunction with other technical and fundamental analysis tools to confirm the validity of signals.
In conclusion, the 200-day moving average is a widely used technical indicator that helps traders and investors analyze the overall trend of a security. By understanding the relationship between a security’s current price and its 200-day moving average, traders can make more informed trading decisions and potentially improve their profitability.
The 200-day moving average is a technical indicator used by traders to analyze the trend of an asset over a long-term period. It is calculated by taking the average closing price of the asset over the past 200 trading days. The moving average is plotted on a chart to create a smooth line that represents the average price over time.
Read Also: What is FFMC: A Comprehensive Guide to Understanding FFMCs
Traders use the 200-day moving average to identify the overall direction of the asset’s price movement. When the price is above the moving average, it is considered a bullish signal indicating an upward trend. Conversely, when the price is below the moving average, it is seen as a bearish signal indicating a downward trend.
One of the key uses of the 200-day moving average is to help traders filter out short-term price fluctuations and focus on the long-term trend. By looking at the moving average, traders can determine whether the current price is in line with the overall trend or if it is deviating from it. This information can help traders make more informed decisions when buying or selling assets.
It’s important to note that the 200-day moving average is just one of many technical indicators used in trading. Traders often use a combination of indicators and strategies to analyze the market and make trading decisions.
The 200-day moving average is a widely used technical indicator that calculates the average closing price of a security over a 200-day period. It is often used by traders and investors to identify trends and make informed decisions about buying or selling securities.
The 200-day moving average is calculated by adding up the closing prices of a security over the past 200 days, and then dividing that sum by 200. This calculation is done each day to provide a moving average that reflects the most recent 200 days of trading.

The 200-day moving average has several uses for traders and investors. It can be used to identify the overall trend of a security, as well as potential support and resistance levels. It can also be used as a signal to buy or sell a security, depending on its relationship to the current price.
There are several strategies that can be used with the 200-day moving average. One common strategy is to buy a security when its price crosses above the 200-day moving average, indicating an uptrend, and to sell when its price crosses below the 200-day moving average, indicating a downtrend. Another strategy is to use the 200-day moving average as a trailing stop loss, where the stop loss level is set at a certain percentage below the moving average.

Is Forex Trading a Good Investment Option? Forex trading, also known as foreign exchange trading or currency trading, is the buying and selling of …
Read Article
Level 1 vs Level 2 Questrade: Understanding the Differences When it comes to online trading platforms, Questrade is a name that often comes up. It …
Read Article
Reasons Why Retail Traders Lose Money in Forex Trading in the forex market can be an enticing prospect for retail traders, offering the potential for …
Read Article
Margin percentage on OANDA: A Complete Guide Margin percentage is an important concept for traders in the financial market, as it determines the …
Read Article
Understanding the Difference Between RSU Grants and Vested Shares When it comes to employee compensation, companies often offer employees various …
Read Article
What does SMA say? Welcome to [Website Name], your one-stop source for insights and analysis on the latest news and trends in the SMA (Social Media …
Read Article


