


How Much Capital Do You Need to Trade Forex for a Living?
Capital Requirements for Forex Trading as a Full-Time Occupation If you’re considering trading forex as a way to make a living, one of the most …
Read Article
Bollinger Bands is a popular technical analysis tool that helps traders analyze the volatility and potential price movements of a financial instrument. Developed by John Bollinger in the early 1980s, Bollinger Bands consist of a simple moving average (SMA) and two standard deviation lines, which are plotted on either side of the SMA.
The Bollinger Band Trap, however, refers to a common pitfall that traders can easily fall into when using Bollinger Bands as part of their trading strategy. This trap occurs when traders solely rely on Bollinger Bands to make trading decisions without considering other factors or confirming signals from other indicators.
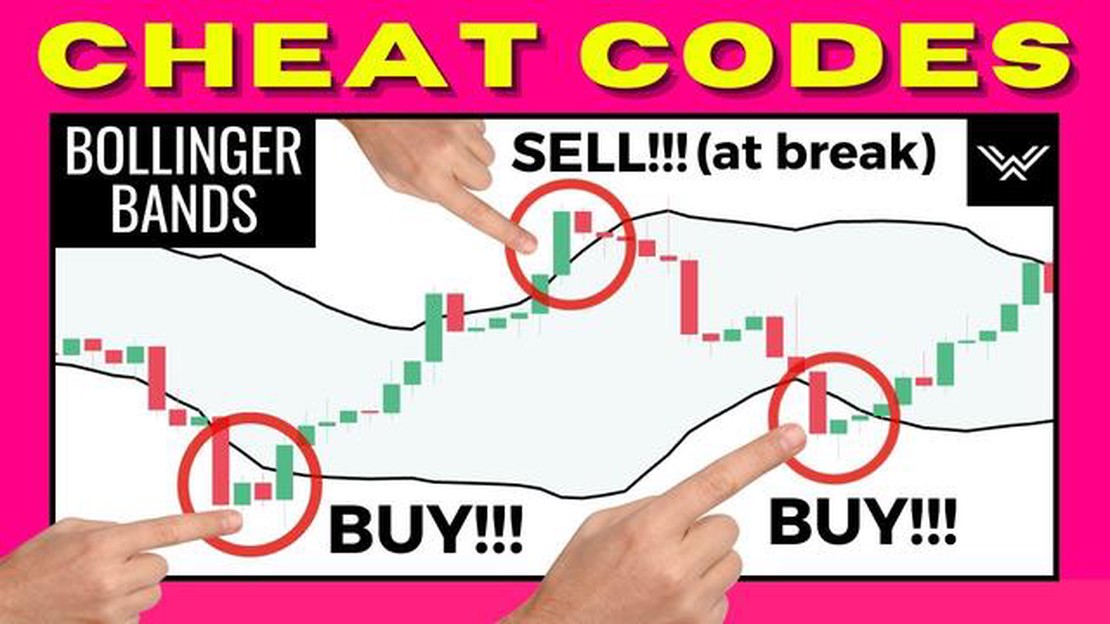
Traders often fall into the Bollinger Band Trap when they see the price touching or crossing one of the outer bands. They interpret this as a signal to buy or sell, assuming that the price will reverse direction and move back towards the middle band. Unfortunately, this approach can lead to false signals and losses.
To avoid falling into the Bollinger Band Trap, traders need to understand the limitations of this indicator and use it in conjunction with other indicators or strategies. This comprehensive guide will delve deeper into the Bollinger Band Trap, explore its causes, and provide valuable insights on how to overcome it.
The Bollinger Band trap is a common strategy used by traders to identify potential reversals or breakouts in the financial markets. Developed by renowned trader John Bollinger, the Bollinger Bands are a technical analysis tool that consists of a moving average and an upper and lower band.
The moving average is used as a measure of the average price over a specific period of time, while the upper and lower bands are plotted two standard deviations away from the moving average. The width of the bands expands and contracts with market volatility, providing valuable information about price levels and potential trading opportunities.
When the price touches the upper band, it is considered overbought, indicating a potential reversal or pullback. On the other hand, when the price touches the lower band, it is considered oversold, indicating a potential reversal or bounce. Traders often look for price action signals, such as candlestick patterns or momentum indicators, to confirm these potential reversals.
However, the Bollinger Band trap occurs when traders rely solely on the price touching the upper or lower band as a signal to enter a trade, without considering other factors. This can lead to false signals and potential losses.
To avoid falling into the Bollinger Band trap, traders should use the Bollinger Bands in conjunction with other technical analysis tools and indicators. This can include trend lines, support and resistance levels, and volume indicators. By combining multiple signals, traders can increase the probability of a successful trade and reduce the risk of false signals.

In addition, it is important to consider the overall market conditions and the larger trend. The Bollinger Bands are not meant to be used in isolation but should be used as part of a comprehensive trading strategy.
Overall, the Bollinger Band trap can be a useful tool for identifying potential reversals or breakouts in the financial markets. However, traders should be aware of its limitations and use it in conjunction with other analysis techniques to increase the likelihood of success.
Bollinger Bands are a technical analysis tool developed by John Bollinger in the 1980s. They are used to measure the volatility of a financial instrument, such as a stock or a currency pair, and to identify potential buy or sell signals.
The concept behind Bollinger Bands is based on the idea that prices tend to stay within a certain range most of the time. The bands consist of three lines plotted on top of a price chart: a middle line, which is a simple moving average (typically the 20-day moving average), and two outer bands that are a specified number of standard deviations away from the middle line.
The space between the upper and lower bands is known as the “bandwidth” and it expands or contracts based on the volatility of the price. When the price is more volatile, the bands widen, and when it is less volatile, the bands narrow.
Read Also: How much is 1 euro in nrp? Find out the exchange rate here
Bollinger Bands are often used to identify potential entry and exit points in the market. When the price reaches the upper band, it indicates that the instrument is overbought and a sell signal may be generated. Conversely, when the price reaches the lower band, it signifies that the instrument is oversold and a buy signal may be generated.
Traders also look for periods of low volatility, where the bands are contracting, as it may indicate that a period of high volatility and a potential price breakout is imminent.
It’s important to note that Bollinger Bands should not be used in isolation and should be combined with other technical analysis tools and indicators to make more informed trading decisions. Additionally, market conditions and other external factors should also be considered when interpreting Bollinger Bands.
In conclusion, Bollinger Bands are a popular volatility indicator used by traders to identify potential buy or sell signals in the market. They provide a visual representation of price volatility and are commonly used in conjunction with other technical analysis tools.
Read Also: When Does the Forex Market Open Today? Find Out Now
Bollinger Bands are a technical analysis tool that consists of a simple moving average (SMA), an upper band, and a lower band. The SMA is typically set at a 20-day period and acts as the centerline for the Bollinger Bands.
The upper band is calculated by adding two standard deviations to the SMA, while the lower band is calculated by subtracting two standard deviations from the SMA. This creates a channel or envelope around the SMA, with the upper and lower bands representing the levels of potential support and resistance.
Bollinger Bands are mainly used to determine the volatility and potential price reversal points in a market. When the market is more volatile, the bands widen, and when the market is less volatile, the bands narrow. During periods of high volatility, prices often move between the bands, testing the upper and lower bounds. Traders can use this information to identify periods of low volatility and anticipate potential breakouts.
In addition to volatility, Bollinger Bands can also be used to identify overbought and oversold conditions. When the price reaches the upper band, it is considered overbought, and when it reaches the lower band, it is considered oversold. Traders can use this information to look for potential trend reversals or entry points.
It is important to note that Bollinger Bands are not a standalone indicator and should be used in conjunction with other technical analysis tools to confirm signals. They are best used in trending markets, as they may provide false signals in sideways or choppy markets.

Bollinger Bands are a technical analysis tool created by John Bollinger. They consist of a moving average line, an upper band, and a lower band. The upper and lower bands are placed two standard deviations away from the moving average, creating a volatility-based trading envelope.
The purpose of Bollinger Bands is to provide a visual representation of price volatility. Traders use Bollinger Bands to identify periods of low volatility (squeeze) and high volatility (expansion). They can also be used to determine overbought and oversold conditions in the market.
Bollinger Bands help traders in identifying reversals by signaling potential breakout or breakdown situations. When the price touches or crosses the upper band, it may indicate a potential reversal to the downside. Similarly, when the price touches or crosses the lower band, it may indicate a potential reversal to the upside. Traders look for confirmation from other technical indicators before taking any trading decisions.
Yes, Bollinger Bands can be used as a standalone trading strategy. Traders can use Bollinger Bands to identify overbought and oversold conditions and take trades accordingly. However, it is recommended to use Bollinger Bands in conjunction with other technical indicators or chart patterns to increase the probability of successful trades.
Some common mistakes traders make when using Bollinger Bands include using them in isolation without considering other indicators or chart patterns, relying solely on Bollinger Bands for entry and exit signals, and not adjusting the parameters of the Bollinger Bands to suit the market conditions. It is important to remember that Bollinger Bands are just one tool among many and should be used in conjunction with other indicators for comprehensive analysis.
Bollinger Bands are a technical indicator used in trading to analyze price volatility. They consist of a middle band, which is a simple moving average, and two outer bands that are standard deviations of the middle band. The bands expand and contract based on price volatility, providing a visual representation of how volatile the market is. When the price touches or crosses the outer bands, it is often seen as a potential trading opportunity.
Bollinger Bands can be used as a trap when traders solely rely on them to make trading decisions. When the price touches or crosses the outer bands, it may seem like a good time to enter a trade. However, this can sometimes be a trap because price volatility can cause fake-outs where the price quickly reverses its direction. It is important to confirm signals from Bollinger Bands with other indicators or analysis techniques before making a trade.

Capital Requirements for Forex Trading as a Full-Time Occupation If you’re considering trading forex as a way to make a living, one of the most …
Read Article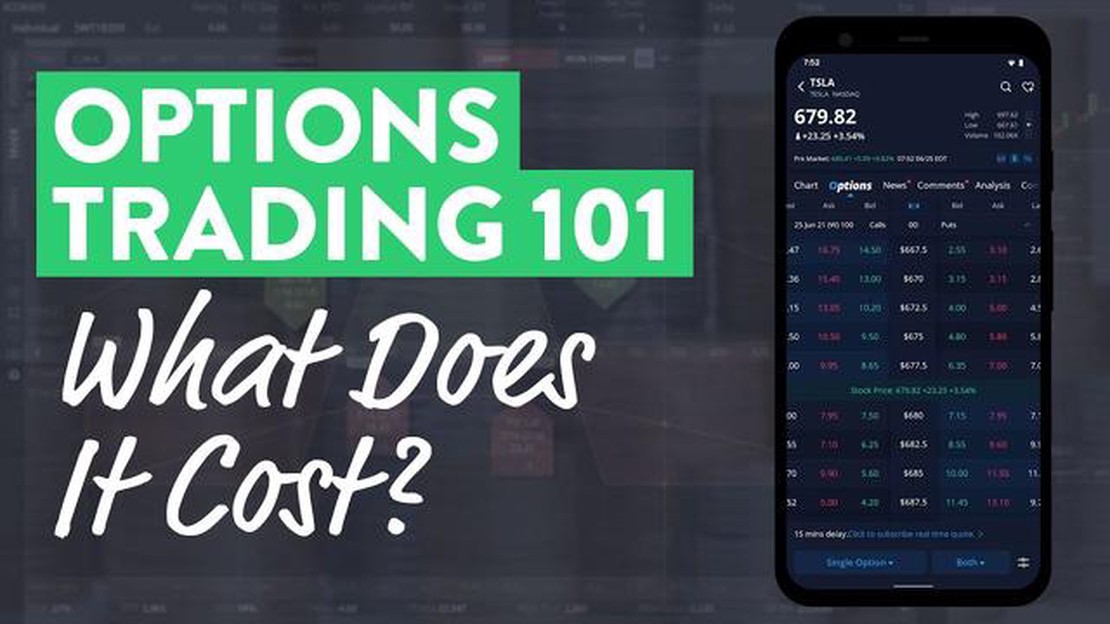
How much money is required to trade options? Options trading is a popular and potentially lucrative investment strategy. It allows investors to …
Read Article
What is the cost of one share of DreamWorks? How Much is One Share of DreamWorks?DreamWorks Share Price and Stock Information DreamWorks Animation is …
Read Article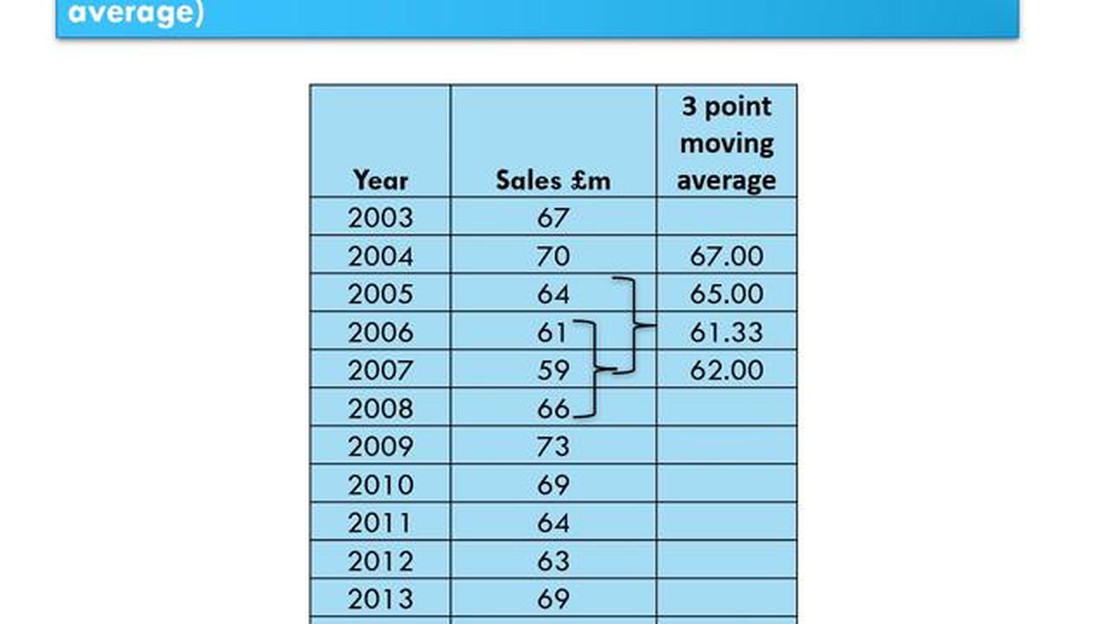
Understanding the 3 Period Moving Average If you’re new to trading or investing, understanding technical analysis can be overwhelming. One commonly …
Read Article
What is the bonus rate for OctaFX? Are you looking to maximize your trading potential? Look no further than OctaFX’s Bonus Rate promotion! With this …
Read Article
Simple Steps to Download MT4 on Android MetaTrader 4 (MT4) is a popular trading platform among forex traders, known for its advanced features and …
Read Article


