

Discover the Secrets to Achieving 50 Pips in Forex Trading
How to Make 50 Pips in Forex Trading Are you a forex trader looking to amp up your profits? Look no further! In this article, we reveal the secrets to …
Read Article
The 30-day moving average is a commonly used technical indicator in financial markets. It is a tool that can help investors and traders better understand the trend and momentum of a particular asset. By calculating the average price over a specific period of time, usually 30 days, the moving average can provide insights into the overall direction of the market.
So, how does the 30-day moving average work? It is calculated by taking the sum of the closing prices of an asset over the past 30 trading days and dividing it by 30. This calculation is repeated every day, taking into account the most recent closing price and dropping off the oldest closing price in the calculation. This creates a dynamic average that adjusts as new data becomes available.

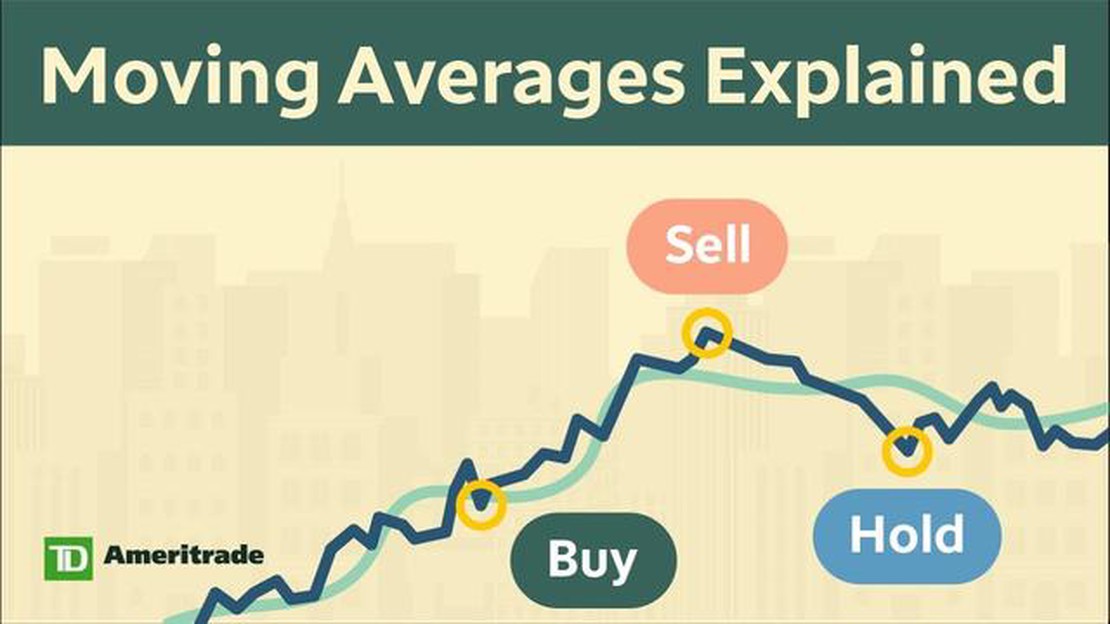
The significance of the 30-day moving average lies in its ability to smooth out short-term price fluctuations and reveal the underlying trend. By focusing on the average price over a longer period of time, it helps filter out noise and highlight the overall direction of the market. For example, if the current price is above the 30-day moving average, it suggests an uptrend, while a price below the moving average indicates a downtrend.
Traders and investors often use the 30-day moving average as a tool for making informed decisions. It can act as a support or resistance level, helping to identify potential buying or selling opportunities. It can also be used in conjunction with other technical indicators to confirm or validate signals. However, it is important to note that the 30-day moving average is just one tool among many, and should not be used in isolation to make trading decisions.
A moving average is a commonly used statistical indicator that helps to smooth out fluctuations in data and identify trends over a specific time period. It is calculated by taking the average of a set of data points over that period, with each subsequent data point replacing the oldest one in the calculation.
Read Also: Best Sources for Free Historical Stock Data
The moving average is frequently used in finance and trading to analyze price trends and make informed decisions. It is also widely used in technical analysis, where it acts as a lagging indicator that helps traders and investors filter out short-term price fluctuations and focus on the overall direction of the market.
The most common type of moving average is the simple moving average (SMA), which calculates the average price over a specified number of periods. Another popular type is the exponential moving average (EMA), which gives more weight to recent data points and places less emphasis on older data.
The choice of the moving average type and the time period depends on the specific application and the data being analyzed. Traders may use different moving averages to analyze short-term and long-term trends or to identify potential support and resistance levels.
In summary, a moving average is a statistical indicator that helps to identify trends and smooth out fluctuations in data. It is widely used in finance and trading to analyze price movements and make informed decisions.
The 30-day moving average is an important tool used in technical analysis to evaluate the overall trend of a stock or asset. It smoothes out short-term price fluctuations, providing traders and investors with a clearer picture of the underlying trend.
Here are a few reasons why the 30-day moving average is significant:
In conclusion, the 30-day moving average is an important tool in technical analysis that helps traders and investors understand the overall trend of a stock or asset. It can be used to identify trend reversals, support and resistance levels, confirm price action, expose long-term trends, and time entry and exit points. By incorporating the 30-day moving average into their analysis, market participants can make more informed trading decisions.
The 30-day moving average is a calculation that shows the average price over the past 30 days for a particular security or asset. It is commonly used in technical analysis to identify trends and support and resistance levels.
Read Also: Who is the CEO of XE com? | XE com CEO Latest Updates
The 30-day moving average is calculated by summing up the prices of the security or asset over the past 30 days and dividing it by 30. This provides a smoothed out line that helps to filter out short-term fluctuations and highlight long-term trends.
The 30-day moving average is significant because it helps to identify the overall trend of a security or asset. It is often used by traders and analysts to determine whether an asset is in an uptrend or a downtrend and to make decisions based on that information.
One common strategy using the 30-day moving average is the crossover strategy. This involves watching for the 30-day moving average to cross above or below the shorter-term moving average, such as the 10-day moving average. Another strategy is using the 30-day moving average as a support or resistance level, where traders may buy when the price dips below the 30-day moving average and sell when it goes above.

Yes, the 30-day moving average can be used for all types of assets, including stocks, commodities, cryptocurrencies, and forex pairs. It is a widely used indicator in technical analysis and can be applied to any market that has enough price data available.

How to Make 50 Pips in Forex Trading Are you a forex trader looking to amp up your profits? Look no further! In this article, we reveal the secrets to …
Read Article
Trading with ROC: A Complete Guide Trading can be an exciting and profitable venture if done correctly. One tool that traders often use is the Rate of …
Read Article
Discover the Benefits of FOREX Trading Foreign exchange, also known as FOREX or FX, is the largest and most liquid financial market in the world. …
Read Article
Calculating Stock Options: A Comprehensive Guide Stock options are a popular form of compensation for employees and can also be a profitable …
Read Article
Is stock options trading profitable? Stock options trading is a popular investment strategy that offers the potential for significant profit. However, …
Read Article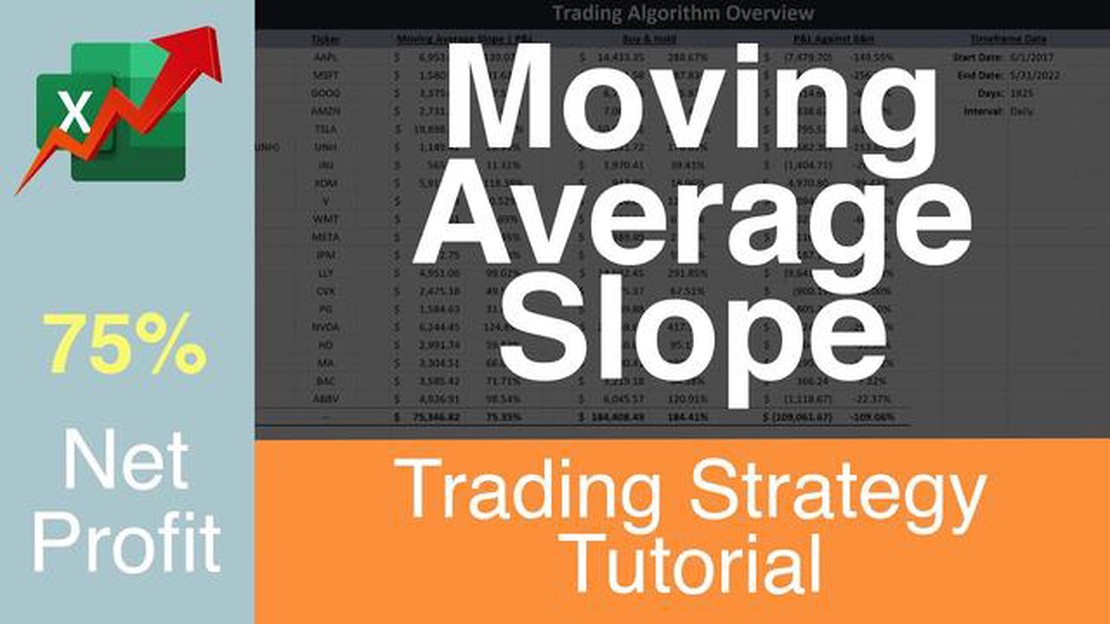
What is the moving average gradient? Data analysis plays a crucial role in various fields, from finance to marketing, by providing valuable insights …
Read Article


