


USD to RUB forecast: Find out the latest prediction for the exchange rate
USD to RUB Prediction: Analyzing the Exchange Rate Forecast The exchange rate between the United States Dollar (USD) and the Russian Ruble (RUB) is …
Read Article
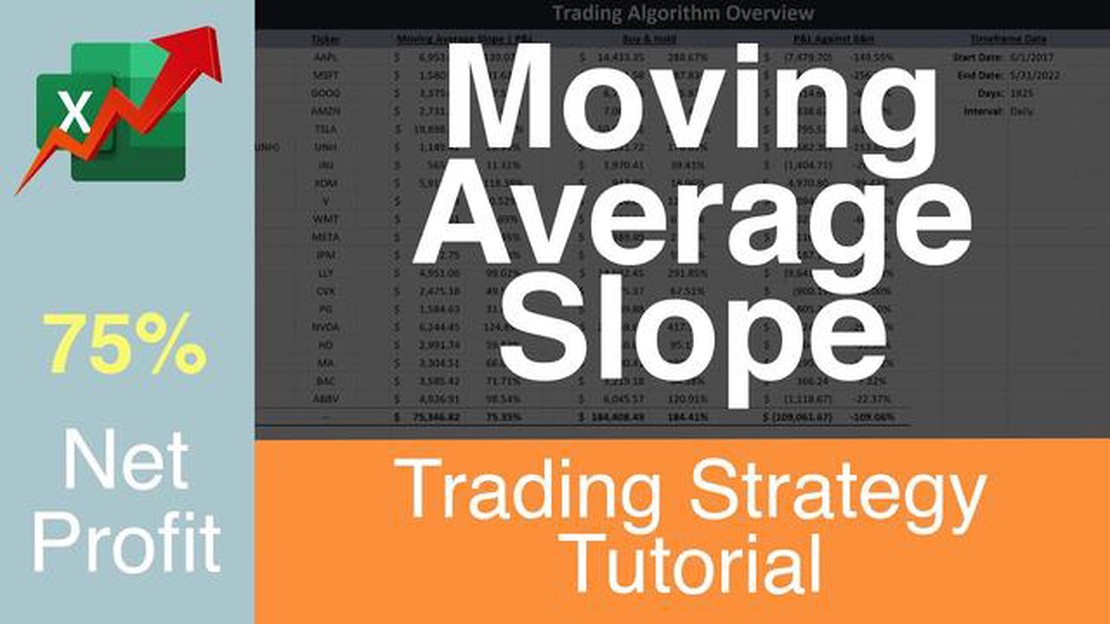
Data analysis plays a crucial role in various fields, from finance to marketing, by providing valuable insights and trends. One essential technique used in data analysis is the moving average gradient, which helps analysts make informed decisions based on historical data. The moving average gradient measures the rate of change in a particular data set by calculating the slope of the moving average line.
The moving average line is created by taking the average of a set of data points over a specific time frame, often referred to as the window size. By analyzing the gradient of this line, analysts can obtain valuable information about the direction and strength of a trend.
Understanding the moving average gradient is essential because it allows analysts to identify whether a trend is strengthening or weakening. A positive gradient indicates an upward trend, suggesting that the variable being analyzed is experiencing growth. On the other hand, a negative gradient indicates a downward trend, implying a decline in the variable.
The moving average gradient also helps analysts identify turning points in a trend. When the gradient changes from positive to negative or vice versa, it indicates a potential change in the direction of the trend. This information is crucial for making accurate predictions and decisions.
In summary, the moving average gradient is a powerful tool in data analysis that provides insights into the rate of change in a data set. By analyzing the direction and strength of a trend through the gradient, analysts can make informed decisions and predictions, ultimately leading to successful outcomes. Understanding this concept is vital for anyone involved in data analysis and can greatly enhance their analytical capabilities.
The moving average gradient is a valuable tool in data analysis that helps identify trends and patterns in a dataset. It is particularly useful when dealing with time series data, as it allows us to smooth out the noise and focus on the underlying trends.

The moving average gradient is calculated by taking the difference between two moving averages, where each moving average is calculated using a different number of data points. Typically, a shorter moving average is used to capture short-term fluctuations, while a longer moving average is used to capture long-term trends.
By calculating the gradient of the moving averages, we can determine the direction and strength of the underlying trend. A positive gradient indicates an increasing trend, while a negative gradient indicates a decreasing trend. The magnitude of the gradient can also provide insights into the strength of the trend. A larger gradient suggests a stronger trend, while a smaller gradient suggests a weaker trend.
Understanding the moving average gradient is crucial in data analysis as it helps us make informed decisions and predictions. For example, in finance, the moving average gradient can be used to identify potential buy or sell signals for stocks. In weather forecasting, the moving average gradient can help us predict future temperature trends.
In conclusion, the moving average gradient is a powerful tool that allows us to uncover trends and patterns in a dataset. By calculating the difference between two moving averages, we can determine the direction and strength of the underlying trend. This knowledge is essential in data analysis as it enables us to make accurate predictions and informed decisions.
The moving average gradient is a measure that quantifies how much a moving average line is inclining or declining at any given point in a data set. It is a useful tool in data analysis as it provides insights into the trend and directionality of a data series. The moving average gradient is calculated by taking the difference between two consecutive moving average values and dividing it by the time interval between them.
Read Also: Understanding the Fee for HK Stock Scrip: All You Need to Know
The moving average gradient can be positive, indicating an upward trend, or negative, indicating a downward trend. A zero gradient would indicate a flat or horizontal trend. By analyzing the moving average gradient, analysts can identify whether a data series is experiencing an overall increase or decrease over time, helping them make informed decisions and predictions.
The moving average gradient is particularly important in time series analysis, where it can help identify turning points and changes in directionality. It can also be used to smooth out noise in a data set and highlight long-term trends. Additionally, the moving average gradient can be used as a tool for forecasting future values based on historical data patterns.
Read Also: Is the 200-day moving average better than buy and hold? Exploring the benefits and drawbacks
To visualize the moving average gradient, analysts often plot the gradient values as a separate line on a graph alongside the actual data series. This allows for easier interpretation and comparison of the trend and directionality.
| Year | Data | Moving Average | Gradient |
|---|---|---|---|
| 2010 | 10 | - | - |
| 2011 | 15 | - | - |
| 2012 | 20 | 15 | -1 |
| 2013 | 25 | 17.5 | 0.5 |
| 2014 | 30 | 22.5 | 1 |
In the example table above, the gradient values are calculated based on a simple moving average with a time interval of one year. As the table shows, the gradient starts at “-” for the first two years as there are no previous values to calculate the difference. In 2012, the first non-zero gradient value is calculated as -1, indicating a declining trend. In 2013 and 2014, the gradient values become positive, indicating an upward trend.
Overall, the moving average gradient serves as a valuable tool in data analysis, providing insights into the trend and directionality of a data series, helping analysts identify turning points, and facilitating forecasting based on historical data patterns.
The moving average gradient is a measure of how the average value of a dataset is changing over time. It is calculated by taking the difference between the moving averages of two consecutive time periods and dividing it by the time period length.

The moving average gradient is important in data analysis because it provides insights into the trend and direction of the data. It helps identify whether the data is increasing, decreasing, or remaining stable over time, which is crucial for making informed business decisions.
Yes, the moving average gradient can help in forecasting future trends. By analyzing the rate of change in the moving averages, data analysts can make predictions about the future behavior of the dataset. However, it’s important to note that it is just one of the tools used in forecasting and should be used in conjunction with other analytical techniques.
There is no specific time period that should be used when calculating the moving average gradient. The choice of time period depends on the specific dataset and the analysis objectives. Shorter time periods provide more responsiveness to recent changes, while longer time periods provide a smoother overall trend.
Some limitations of using the moving average gradient include its sensitivity to outliers and noise in the data. It may smooth out short-term fluctuations and make it difficult to identify sudden changes in the data. Additionally, the moving average gradient may not be appropriate for datasets with irregular patterns or seasonal variations.

USD to RUB Prediction: Analyzing the Exchange Rate Forecast The exchange rate between the United States Dollar (USD) and the Russian Ruble (RUB) is …
Read Article
History of 0DTE Options: Origins and Evolution Options trading has been a popular strategy for investors looking to diversify their portfolios and …
Read Article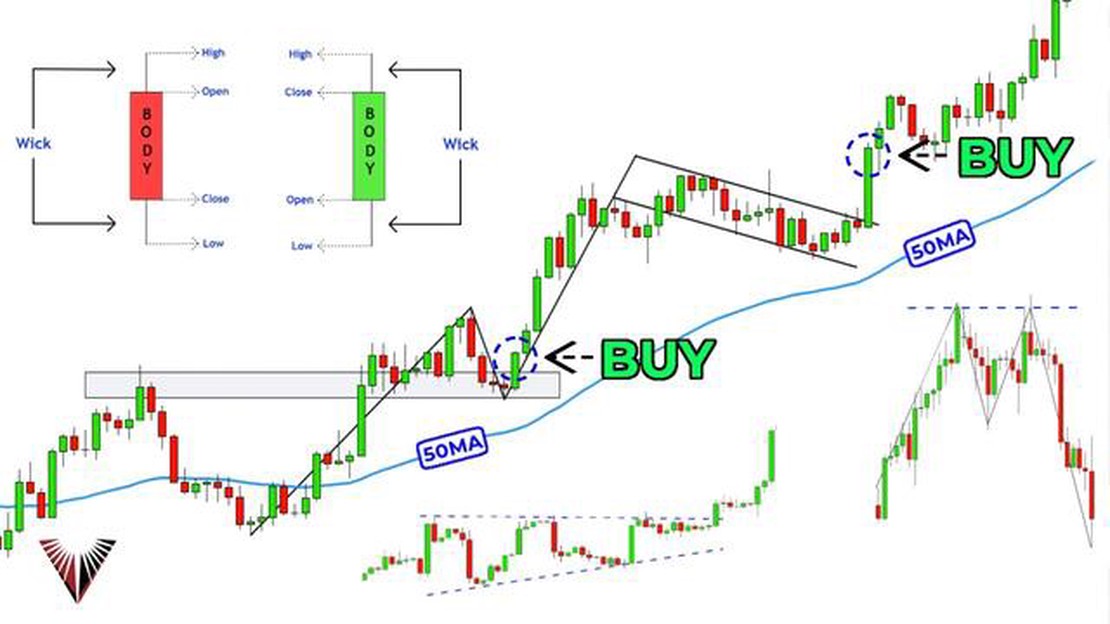
Master the Art of Analyzing Forex Trends Forex trading is a complex and dynamic market where market trends can play a crucial role in determining the …
Read Article
Ice futures trading: What commodities are traded? Welcome to our guide on Ice Futures, where we will explore the most popular futures traded on the …
Read Article
International Branches of BDO BDO, also known as Banco de Oro, is one of the largest banks in the Philippines. But does it have any international …
Read Article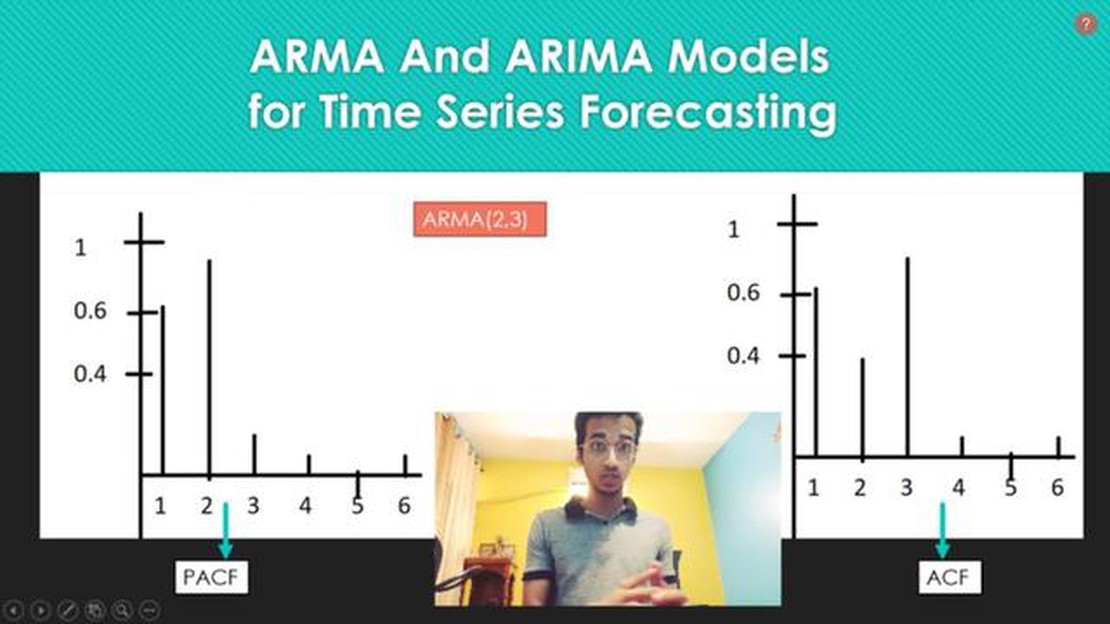
What is the difference between ARIMA and VARMA? In the field of time series analysis, two commonly used models for forecasting and understanding the …
Read Article


