


Beginner's Guide: How to Trade on SGX - Step-by-Step Instructions
SGX Trading: A Step-by-Step Guide Welcome to our beginner’s guide on how to trade on the Singapore Exchange (SGX). Whether you’re new to trading or …
Read Article
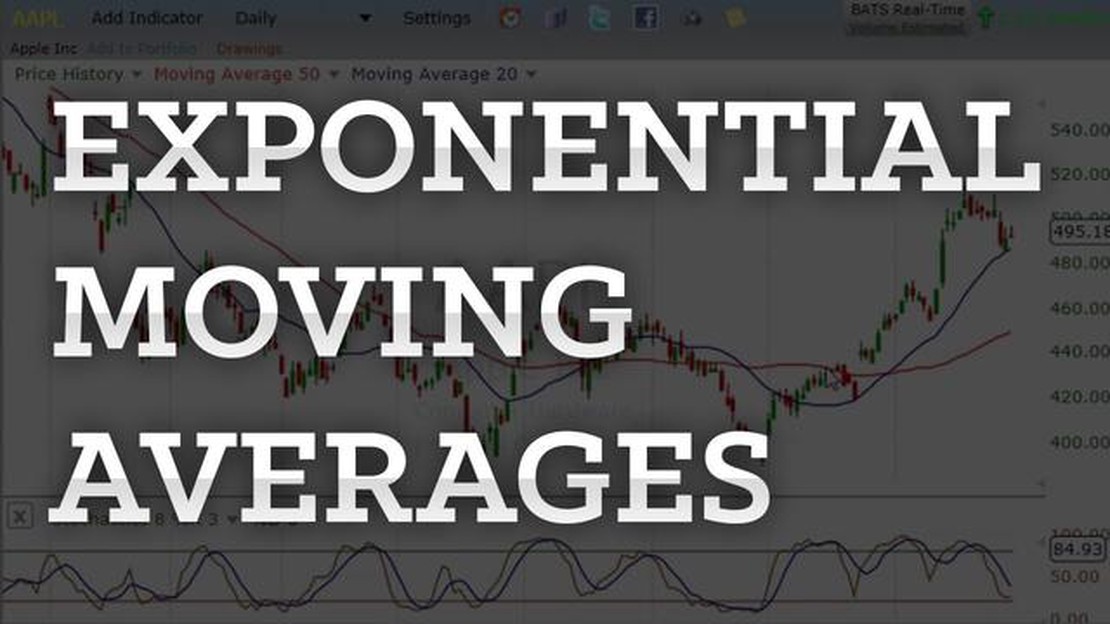
The 12 Period Exponential Moving Average (EMA) is a powerful technical analysis tool used by traders and investors to identify trends and make informed decisions in the financial markets. In this comprehensive guide, we will dive deep into the world of EMA and explore its inner workings, benefits, and practical applications.
What is the 12 Period EMA?
The 12 Period EMA is a moving average calculation that places greater weight and significance on more recent price data points. Unlike the simple moving average (SMA), which assigns equal weight to all data points, the EMA gives more importance to recent prices, making it more responsive to the current market conditions. This makes it particularly useful for traders who want to capture short-term trends and react quickly to market movements.
How is the 12 Period EMA Calculated?

To calculate the 12 Period EMA, you start by selecting a time period, typically 12, and gathering the closing prices for that period. You then apply a specific formula that considers both the previous EMA value and the current period’s closing price. By repeating this process, you can create a series of EMA values that represent the smoothed trend of the underlying data.
“The 12 Period EMA offers a balance between responsiveness and smoothness. It provides traders with a reliable indicator that captures short-term trends without excessive noise”
Benefits and Practical Applications
Read Also: Understanding Delta and Theta in Options | An In-Depth Explanation
The 12 Period EMA offers a balance between responsiveness and smoothness. It provides traders with a reliable indicator that captures short-term trends without excessive noise. This makes it valuable in various trading strategies, such as trend following, momentum trading, and even mean reversion. Traders can use the 12 Period EMA to generate buy and sell signals, identify potential entry and exit points, and manage risk effectively.
The 12 Period Exponential Moving Average (EMA) is a technical analysis indicator that is commonly used by traders and investors to analyze price trends. It is a type of moving average that gives more weight to recent price data, making it more responsive to changes in price compared to other types of moving averages.
The EMA is calculated by taking the average of a specified number of periods, in this case 12, and giving more weight to the most recent periods. This is done by using a multiplier that is derived from the number of periods. The formula for calculating the 12 Period EMA is as follows:
The 12 Period EMA is typically used by traders and investors to identify the direction of the trend and to generate trading signals. When the price is above the 12 Period EMA, it is considered a bullish signal, indicating that the trend is upward. Conversely, when the price is below the 12 Period EMA, it is considered a bearish signal, indicating that the trend is downward.
Traders and investors can also use the 12 Period EMA to generate buy and sell signals. For example, when the price crosses above the 12 Period EMA, it can be seen as a buy signal, indicating that the trend is reversing and that it may be a good time to enter a long position. Conversely, when the price crosses below the 12 Period EMA, it can be seen as a sell signal, indicating that the trend is reversing and that it may be a good time to exit a long position.
Overall, the 12 Period EMA is a widely used technical analysis indicator that can provide valuable insights into price trends and generate trading signals. It is important to note that no indicator is perfect, and traders and investors should use the 12 Period EMA in conjunction with other technical analysis tools to make informed trading decisions.
The 12 Period Exponential Moving Average (EMA) is a widely-used technical analysis tool that provides traders with valuable insights into the market trends. Here are some of the benefits and uses of the 12 Period EMA:
Overall, the 12 Period EMA is a versatile technical analysis tool that provides traders with valuable information about market trends, support and resistance levels, trend reversals, price momentum, entry and exit signals, stop loss placement, and multiple time frame analysis. By incorporating the 12 Period EMA into their trading strategies, traders can enhance their decision-making process and potentially improve their trading outcomes.
Read Also: Is there a foolproof strategy for winning 100% of the time in forex trading?
The 12-period exponential moving average is a technical indicator used in stock analysis to track the average price of a stock over the past 12 periods, weighting more recent prices more heavily than older prices.
The exponential moving average is more popular than the simple moving average because it gives greater weight to more recent data points, allowing it to respond more quickly to changes in the price trend.
The 12-period exponential moving average is calculated by taking the smoothing factor (2 / (12 + 1)) and multiplying it by the current price, then adding that to the previous period’s exponential moving average multiplied by (1 - smoothing factor).

The advantages of using the 12-period exponential moving average include its ability to quickly respond to changes in the price trend, its ability to filter out minor price fluctuations, and its usefulness in identifying support and resistance levels.
The 12-period exponential moving average can be used in trading strategies as a signal for buying or selling stocks. For example, a trader may consider buying when the stock price crosses above the 12-period exponential moving average and selling when it crosses below.

SGX Trading: A Step-by-Step Guide Welcome to our beginner’s guide on how to trade on the Singapore Exchange (SGX). Whether you’re new to trading or …
Read Article
Which is the Better Option: Selling Restricted Stock or ESPP? When it comes to managing your investments, it’s important to consider all of your …
Read Article
Brokers Offering Guaranteed Stop-Loss: All You Need to Know Stop-loss orders are an essential risk management tool for traders in the financial …
Read Article
Latest Version of Windows Phone Windows Phone, developed by Microsoft, was a mobile operating system that was first released in 2010. Over the years, …
Read Article
What is centered moving average of order 5? In the field of statistics and finance, moving averages are commonly used to analyze and interpret data …
Read Article
Understanding Section 110 of the Income Tax Act Section 110 of the Income Tax Act is an important provision that every taxpayer should understand. …
Read Article


