

Are CFDs Riskier than Options? Exploring the Differences
Are CFDs riskier than options? Investing in financial markets often involves taking on a certain level of risk. Two popular trading instruments that …
Read Article
When it comes to technical analysis in the financial markets, Fibonacci indicators have become a powerful tool for traders and investors. Derived from the famous Fibonacci sequence, these indicators can help identify support and resistance levels, predict potential price reversals, and determine the strength of a trend.
What is the Fibonacci sequence?
The Fibonacci sequence is a mathematical concept in which each number is the sum of the two preceding ones. It starts with 0 and 1, and the sequence continues indefinitely. This sequence has been found to have numerous applications in various domains, including the financial markets.
How are Fibonacci indicators used?
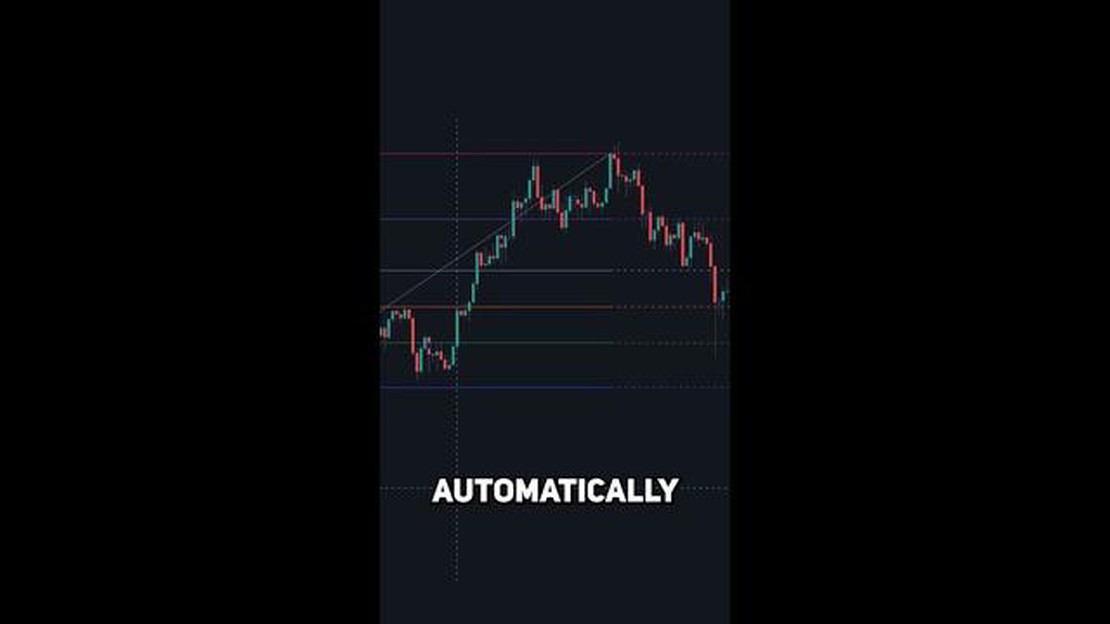
Traders and investors use Fibonacci indicators by applying them to key price points on a chart. These price points can be highs and lows, or any other significant level. By doing so, they can identify potential levels of support and resistance, as well as key areas for price reversal.
For example, the Fibonacci retracement tool is commonly used to identify potential levels of price retracement in a trending market. Traders draw Fibonacci retracement levels from the high to the low of a trend, and look for potential support or resistance at the key Fibonacci levels: 23.6%, 38.2%, 50%, 61.8%, and 78.6%.
Furthermore, Fibonacci extensions can be used to predict potential price targets in an uptrend or downtrend. Traders draw Fibonacci extensions from the low to the high of a trend, and look for potential levels where price may reverse or continue its trend.
In conclusion, understanding Fibonacci indicators is essential for traders and investors who want to effectively analyze and predict price movements in the financial markets. By applying these indicators to key price points, traders can identify support and resistance levels, predict price reversals, and determine the strength of a trend. With practice and experience, Fibonacci indicators can become a valuable tool in a trader’s arsenal.

Fibonacci indicators are a popular technical analysis tool used by traders to identify potential levels of support and resistance in the financial markets. These indicators are based on the Fibonacci sequence, a mathematical concept that dates back to ancient times.
The Fibonacci sequence is a series of numbers where each number is the sum of the two preceding ones. Starting from 0 and 1, the sequence goes like this: 0, 1, 1, 2, 3, 5, 8, 13, 21, and so on. This sequence has many interesting properties and is found in various natural phenomena.
Read Also: Best Places to Trade Vietnamese Dong: Explore Your Options Today
In the context of financial markets, Fibonacci retracement and Fibonacci extension levels are the two most commonly used Fibonacci indicators.
Fibonacci retracement levels are horizontal lines drawn on a price chart to identify potential areas of support or resistance. These levels are calculated by taking a high and low point on a chart and then applying Fibonacci ratios (23.6%, 38.2%, 50%, 61.8%, and 78.6%) to determine potential retracement levels.
Fibonacci extension levels, on the other hand, are used to identify potential areas of price extension beyond the current trend. These levels are calculated by taking a significant swing low and high on a chart and then applying Fibonacci ratios (127.2%, 161.8%, 261.8%, and 423.6%) to determine potential price extension levels.
Fibonacci indicators are based on the idea that markets tend to retrace a portion of a previous move before continuing in the direction of the trend. Traders use these indicators to identify potential entry and exit points, as well as to manage risk by placing stop-loss orders.
It’s important to note that Fibonacci indicators are not foolproof and should be used in conjunction with other technical analysis tools and indicators. They are best used as a guide to supplement other trading strategies and techniques.
In summary, Fibonacci indicators are a tool used by traders to identify potential levels of support and resistance in the financial markets. These indicators are based on the Fibonacci sequence and are used to determine potential retracement and extension levels. While not infallible, Fibonacci indicators can be a valuable addition to a trader’s toolbox.
The use of Fibonacci indicators in technical analysis is based on the mathematical principles discovered by Leonardo Fibonacci, an Italian mathematician from the 13th century. Fibonacci is best known for introducing a sequence of numbers that has come to be known as the Fibonacci sequence.
The Fibonacci sequence starts with the numbers 0 and 1, and each subsequent number is the sum of the two preceding numbers. The sequence goes as follows: 0, 1, 1, 2, 3, 5, 8, 13, 21, 34, 55, and so on. This sequence has many fascinating properties and has been studied by mathematicians and scientists for centuries.
Read Also: Discover the Most Reliable Leading Indicator for Forex Trading
The Fibonacci sequence can also be used as a basis for creating ratios, known as Fibonacci ratios or retracement levels. These ratios are derived from the relationship between two consecutive numbers in the Fibonacci sequence. The most commonly used ratios are 23.6%, 38.2%, 50%, 61.8%, and 78.6%.
In technical analysis, Fibonacci retracement levels are plotted on a price chart to identify potential areas of support or resistance. Traders use these levels to help determine where the price of an asset may reverse or continue its trend. The idea behind Fibonacci retracement levels is that markets tend to retrace a portion of their previous move before continuing in the original direction.

Another useful Fibonacci indicator is the Fibonacci extension levels. These levels are used to identify potential price targets or areas of interest beyond the current trend. Traders use Fibonacci extension levels in conjunction with other technical analysis tools to plan their trades and set profit targets.
Overall, the use of Fibonacci indicators in technical analysis has become widely adopted by traders and investors. The principles behind these indicators are based on the inherent mathematical patterns found in the Fibonacci sequence. By understanding and applying Fibonacci indicators, traders can gain insights into market trends and make more informed trading decisions.
Fibonacci indicators are technical analysis tools that use the Fibonacci sequence and ratios to identify potential levels of support and resistance in financial markets.
Fibonacci indicators work by identifying key levels of support and resistance based on the Fibonacci sequence and ratios. These levels are then used by traders to make trading decisions.
Some commonly used Fibonacci indicators include Fibonacci retracement, Fibonacci extensions, and Fibonacci arcs.
Fibonacci indicators can be used in trading to identify potential levels of support and resistance, determine entry and exit points, and set price targets.

Are CFDs riskier than options? Investing in financial markets often involves taking on a certain level of risk. Two popular trading instruments that …
Read Article
Where to Exchange Indonesian Rupiah If you’re planning a trip to Indonesia, it’s important to know where and how to exchange your money to get the …
Read Article
What is the Price of 1k of Silver? Silver is a precious metal that has been used for thousands of years as a medium of exchange, a store of value, and …
Read Article
Pros and Cons of Pre-IPO Stock: Is It a Good Investment? Investing in the stock market can be a rewarding venture, but it also comes with its fair …
Read Article
Understanding the Meaning of a Descending Triangle in Forex Trading When it comes to forex trading, understanding different chart patterns is crucial …
Read Article
Trading Options with Margin: Everything You Need to Know Trading options with margin can be a lucrative strategy for experienced traders, but it is …
Read Article


