


Exploring the Benefits of Exponentially Weighted Moving Average Monitor
What is Exponentially Weighted Moving Average Monitor? Monitoring and analyzing data is essential for businesses to make informed decisions and …
Read Article
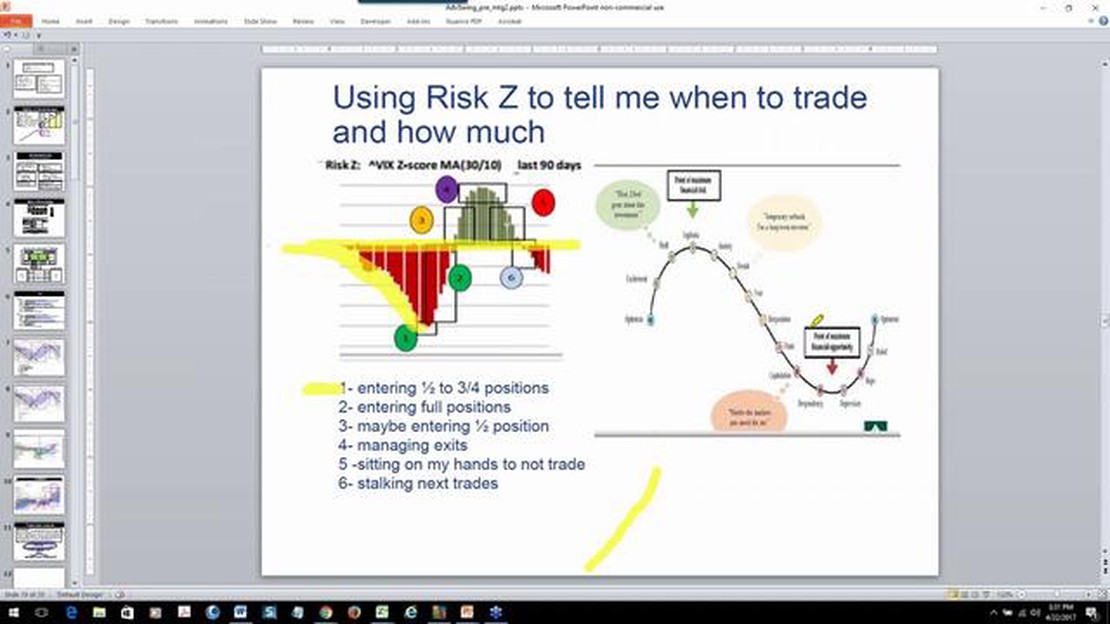
Pairs trading is a popular investment strategy that involves identifying and exploiting the statistical relationship between two or more assets. One key tool used in pairs trading is the Z score, which measures the deviation of a data point from the mean in terms of standard deviations. By understanding and applying the Z score, traders can identify potential trading opportunities and make informed decisions.
The Z score is calculated by taking the difference between the observed value and the mean, and dividing it by the standard deviation. A positive Z score indicates that the observed value is above the mean, while a negative Z score indicates that it is below the mean. The magnitude of the Z score indicates the level of deviation from the mean.
In pairs trading, the Z score is used to identify when the price of one asset diverges from the other asset in the pair. The idea is to take advantage of mean reversion, which suggests that the prices of the two assets will eventually converge back to their historical relationship. When the Z score reaches a certain threshold, traders can initiate a trade by buying the undervalued asset and simultaneously shorting the overvalued asset. As the prices converge, the trader can profit from the price difference.
However, it’s important to note that the Z score alone is not sufficient for making trading decisions. Traders must also consider other factors such as market conditions, trading costs, and overall portfolio risk. Additionally, the Z score assumes that the historical relationship between the two assets will continue in the future, which may not always be the case.
In conclusion, understanding the Z score is essential for pairs trading. By using this statistical measure, traders can identify potential trading opportunities and take advantage of mean reversion. However, it’s important to consider other factors and exercise caution when implementing this strategy. With proper analysis and risk management, the Z score can be a valuable tool in pairs trading.
The Z score is a statistical measure that quantifies how far a data point is from the mean of a dataset in terms of standard deviations. It is commonly used in finance and trading to assess the deviation of a security or asset’s price from its historical mean.
The calculation of the Z score involves subtracting the mean of the dataset from the data point and then dividing the result by the standard deviation. The formula for calculating the Z score can be expressed as:
Z = (X - μ) / σ
Where:
The resulting value of the Z score indicates how many standard deviations the data point is from the mean. A positive Z score suggests that the data point is above the mean, while a negative Z score indicates that the data point is below the mean.
The Z score is used in pairs trading to identify opportunities for trading pairs of securities or assets. The strategy involves identifying two assets that are historically correlated and have temporarily deviated from their typical relationship. A high Z score indicates that the two assets have diverged significantly and may be ripe for a mean reversion, where they are expected to return to their historical relationship.

By using the Z score, traders can identify potential pairs trading opportunities and establish positions that profit from the convergence of the two assets. The Z score helps quantify the level of deviation and provides a systematic approach for pairs trading strategies.
Pairs trading, also known as statistical arbitrage, is a popular trading strategy that aims to profit from the relative price movements of two related securities. This strategy involves taking opposite positions in two related stocks or other financial instruments, with the expectation that the gap between their prices will narrow or revert to the mean.
The Z score is a statistical measure used in pairs trading to determine the relationship between the two securities in a pair. It indicates the number of standard deviations the current spread, or difference in prices, deviates from the mean spread.
Read Also: Understanding the Importance of RSS and SSR in Forex Trading
The Z score is calculated by taking the difference between the current spread and the mean spread, and dividing it by the standard deviation of the spread. The formula for calculating the Z score is as follows:
Z = (current spread - mean spread) / standard deviation of spread
The Z score can be positive or negative, depending on whether the spread is above or below the mean. A positive Z score suggests that the spread is widening, indicating that the two securities are moving away from each other. A negative Z score suggests that the spread is narrowing, indicating that the two securities are moving closer together.
The Z score is a useful tool for identifying potential pairs trading opportunities. Traders look for securities pairs with a high positive or negative Z score, indicating a large deviation from the mean. These pairs are considered to be out of equilibrium and are expected to converge back to the mean, presenting an opportunity for profit.
Read Also: Discover the Top Volume Indicator for Forex TradingView for Better Trading Decisions
However, it’s important to note that the Z score is just one factor to consider in pairs trading. Traders should also consider other factors such as the correlation between the two securities, trading volume, and market conditions.
In conclusion, understanding the Z score is essential for pairs trading as it provides a statistical measure of the relationship between the two securities in a pair. By identifying securities pairs with a high Z score, traders can potentially profit from the convergence of prices back to the mean.
The Z score is an important statistical measure used in pairs trading to assess the relative value of two related financial instruments. It is a standardized measure of the difference between an observed value and the mean value, expressed in terms of standard deviations.

The Z score allows traders to determine whether the relationship between two assets is currently diverging from its historical pattern. This can be a sign of a potential trading opportunity, as it suggests that the relationship between the two assets may correct itself in the future.
By calculating the Z score, traders can identify when an asset is overvalued or undervalued relative to its historical relationship with another asset. This can help them determine when to enter or exit a pairs trade, taking advantage of discrepancies between the two assets.
The Z score is also used to assess the risk and potential profitability of a pairs trade. A high Z score indicates a larger deviation from the mean and therefore a higher potential profit if the relationship between the assets reverts to its historical pattern. However, it also implies a higher level of risk, as there is a greater chance that the relationship will not correct itself.
Additionally, the Z score is a useful tool for risk management. Traders can set thresholds based on the Z score to trigger stop-loss orders or take-profit targets, helping to mitigate potential losses and secure profits.
In summary, the Z score is an important tool for pairs trading as it helps traders assess the relative value of two assets, identify trading opportunities, manage risk, and determine entry and exit points for trades.
The Z score is a statistical measurement that quantifies the deviation from the mean of a data point in terms of standard deviations.
In pairs trading, the Z score is used to identify potential trading opportunities by comparing the distance between two related securities’ prices to their historical relationship.
Mean reversion is the theory that over time, the prices of two related securities will tend to move back toward their average relationship. In pairs trading, traders take advantage of this by opening positions when the prices diverge and closing them when they converge.
The steps involved in calculating the Z score are: 1) Calculate the spread between the two securities’ prices; 2) Calculate the mean and standard deviation of the spread; 3) Calculate the Z score by subtracting the mean from the current spread and dividing by the standard deviation.

What is Exponentially Weighted Moving Average Monitor? Monitoring and analyzing data is essential for businesses to make informed decisions and …
Read Article
What is the best machine learning algorithm for trading? Machine learning algorithms have revolutionized the trading industry, enabling traders to …
Read Article
Is Copy Trading Possible on MT4? Copy trading has become an increasingly popular strategy in the world of forex trading. It allows investors to …
Read Article
How to Trade Triple Tap: Strategies and Tips Trading triple tap is a popular strategy among professional traders who are looking for profitable …
Read Article
Can a strategy stop working in forex? Forex strategies are an essential part of any successful trader’s toolkit. They provide a systematic approach to …
Read Article
European to US Dollar Exchange Rate The euro to dollar exchange rate is an important metric for individuals and businesses alike, as it represents the …
Read Article


