


How to trade football matches: A step-by-step guide
Trading football matches: tips and strategies for success Football trading is a popular form of betting on sports that allows you to profit from the …
Read Article
In the world of trading, identifying and understanding chart patterns is crucial for making informed decisions. One of the most commonly used patterns are LH (Lower High) and LL (Lower Low) patterns. These patterns can provide valuable insights into market trends and potential changes in direction.
LH patterns occur when each successive high point in a chart is lower than the previous high point. This indicates a weakening or reversal of an uptrend, suggesting that sellers are gaining control and pushing prices lower. Traders who can identify LH patterns can use this information to anticipate potential downtrends and adjust their trading strategies accordingly.
On the other hand, LL patterns occur when each successive low point in a chart is lower than the previous low point. This suggests a continuation or strengthening of a downtrend, indicating that sellers are still in control and prices are likely to continue declining. Traders who spot LL patterns can take advantage of this information by selling or shorting the asset, potentially profiting from further price declines.
Overall, understanding and trading LH and LL patterns is an essential skill for any trader. These patterns provide key insights into market trends and can help traders anticipate potential reversals or continuations of trends. By accurately identifying and interpreting LH and LL patterns, traders can make more informed trading decisions and increase their chances of success in the market.
LH and LL patterns are common chart patterns that are used in technical analysis to identify potential trend reversals in the financial markets. LH stands for Lower High, while LL stands for Lower Low. These patterns can be observed in various financial instruments such as stocks, commodities, and currencies.
A LH pattern is formed when the price of an asset creates a high point that is lower than the previous high. This indicates that the sellers are gaining control and the buyers are losing momentum, potentially signaling a reversal in the previous uptrend.
On the other hand, a LL pattern is formed when the price of an asset creates a low point that is lower than the previous low. This suggests that the sellers are still in control and the buyers are unable to push the price higher, potentially indicating a continuation of the downtrend.
LH and LL patterns can be used by traders to make informed trading decisions. For example, a trader may look to enter a short position when a LH pattern is confirmed, as it suggests a potential trend reversal to the downside. Conversely, a trader may consider entering a long position when a LL pattern is confirmed, as it suggests a continuation of the downtrend.

It’s important to note that LH and LL patterns should be analyzed in conjunction with other technical analysis tools and indicators to confirm the validity of the patterns. Traders should also consider the overall market context and fundamental factors that may influence the price movement of the asset.
Identifying LH and LL patterns can be a crucial skill for traders looking to take advantage of market trends. These patterns can provide valuable information about potential reversals or continuation of trends, helping traders make informed decisions.
Read Also: What Happens After a 4-Year Vesting Period? Guide to Your Share Options
Here are some steps to help you identify LH and LL patterns:
Remember that LH and LL patterns are not foolproof indicators and should be used in conjunction with other analysis techniques. It’s important to consider the overall market conditions and other factors that might affect the price movement.
By mastering the skill of identifying LH and LL patterns, traders can gain an edge in their trading strategies. These patterns can provide valuable insights into market trends and help traders make more informed trading decisions.
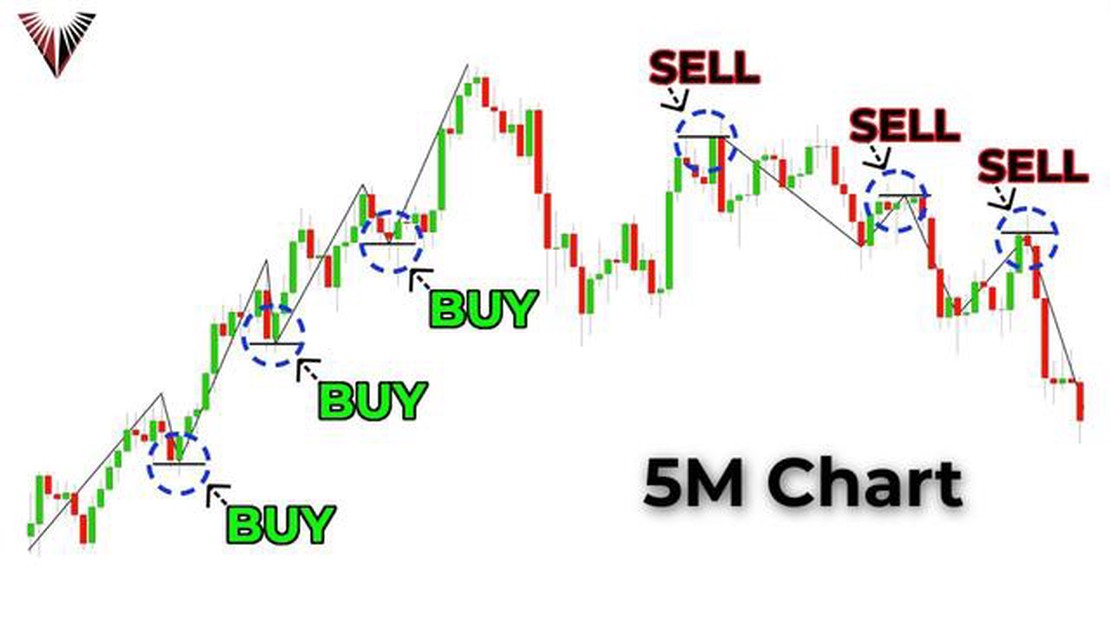
When it comes to trading LH (lower high) and LL (lower low) patterns, using the right strategies and techniques is crucial to success. These patterns can provide valuable insights into the market and help traders pinpoint potential price reversals. Here are some effective strategies and techniques for trading LH and LL patterns:
1. Identifying LH and LL patterns: To trade LH and LL patterns, the first step is to accurately identify them on price charts. LH patterns occur when each high in a price sequence is lower than the previous high, indicating a potential downward trend. LL patterns occur when each low is lower than the previous low, suggesting a potential bearish trend. It is important to confirm these patterns with other technical indicators to reduce the risk of false signals.
2. Waiting for confirmations: Before entering a trade based on LH or LL patterns, it is important to wait for confirmations. This can involve waiting for a close below the previous low in the case of an LL pattern or a close below the previous high in the case of an LH pattern. These confirmations can help reduce the risk of entering trades too early and increase the chances of catching a significant price reversal.
Read Also: Understanding the Risk Reversal and Butterfly Formula: A Comprehensive Guide
3. Using trend lines: Trend lines can be a useful tool for identifying LH and LL patterns and establishing potential entry and exit points. Drawing trend lines connecting the higher highs and lower lows can provide a visual representation of the trend. Traders can enter a short trade when the price breaks below the trend line in an LH pattern or enter a long trade when the price breaks above the trend line in an LL pattern.
4. Implementing stop-loss orders: To manage risk, it is essential to implement stop-loss orders when trading LH and LL patterns. Placing a stop-loss order above the previous high in the case of an LH pattern or below the previous low in the case of an LL pattern can help protect against significant losses if the price does not reverse as anticipated. Traders should also consider using trailing stops to lock in profits as the price moves in their favor.

5. Considering other technical analysis tools: LH and LL patterns are just one aspect of technical analysis, and traders should consider using other tools to confirm their trading decisions. This can include indicators such as moving averages, oscillators, and volume analysis. Combining LH and LL patterns with other technical analysis tools can provide a more comprehensive view of the market and increase the accuracy of trading signals.
By incorporating these strategies and techniques into their trading approach, traders can effectively capitalize on LH and LL patterns and increase their chances of profiting from price reversals. It is important to remember that no trading strategy is foolproof, and proper risk management is crucial to long-term success.
LH stands for lower highs, which means that each high point in a trend is lower than the previous high point. LL stands for lower lows, which means that each low point in a trend is lower than the previous low point. These patterns are used by traders to identify potential trend reversals.
LH and LL patterns can help traders in identifying potential trend reversals. When LH and LL patterns are formed, it indicates that the previous trend is losing momentum and a new trend may be emerging. Traders can use these patterns to make decisions on when to enter or exit trades.
Yes, LH and LL patterns can be used in any market, including stocks, forex, commodities, and cryptocurrencies. These patterns are based on price action, so they can be applied to any market that has a chart.
To identify LH and LL patterns, you need to look for a series of highs and lows. For LH patterns, each high point should be lower than the previous high point. For LL patterns, each low point should be lower than the previous low point. You can draw trendlines connecting the highs or lows to visualize the patterns.
There are several trading strategies that can be used with LH and LL patterns. One strategy is to wait for a LH pattern to form and then enter a short trade as the trend is expected to reverse. Another strategy is to wait for a LL pattern to form and then enter a long trade as the trend is expected to reverse. Traders can also use LH and LL patterns in conjunction with other technical indicators to confirm trading signals.

Trading football matches: tips and strategies for success Football trading is a popular form of betting on sports that allows you to profit from the …
Read Article
Owner of MBA forex When it comes to the world of finance and investments, one name that stands out is MBA Forex. This renowned company has made its …
Read Article
Understanding USD CNH: Definition, Features, and Significance The USD CNH currency pair refers to the exchange rate between the United States dollar …
Read Article
Step-by-Step Guide: Viewing Historical Trades on Interactive Brokers Interactive Brokers is a popular brokerage platform that provides traders and …
Read Article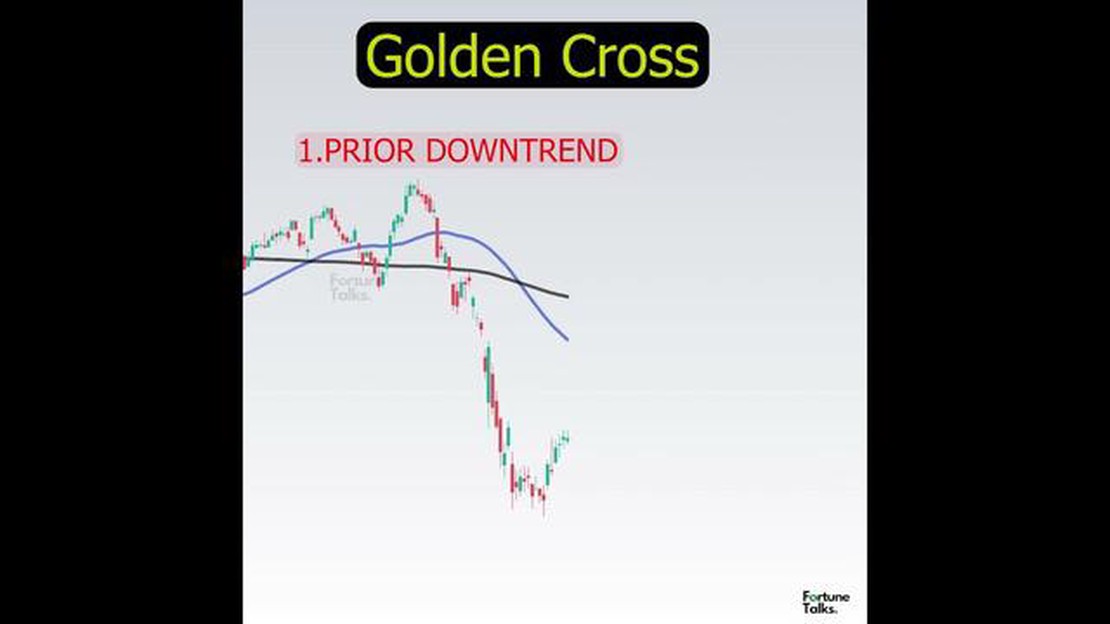
Golden Cross: EMA or SMA? The Golden Cross is a popular technical analysis indicator used by traders and investors to predict bullish trends in the …
Read Article
Understanding the Role of a Forex Company in the Financial Market When it comes to the world of international finance, Forex companies play a vital …
Read Article


