


STP Broker: Understanding the Type and Benefits of Straight Through Processing
STP Broker: What Type Is It? Straight Through Processing (STP) is a method used in the financial industry to electronically process transactions …
Read Article
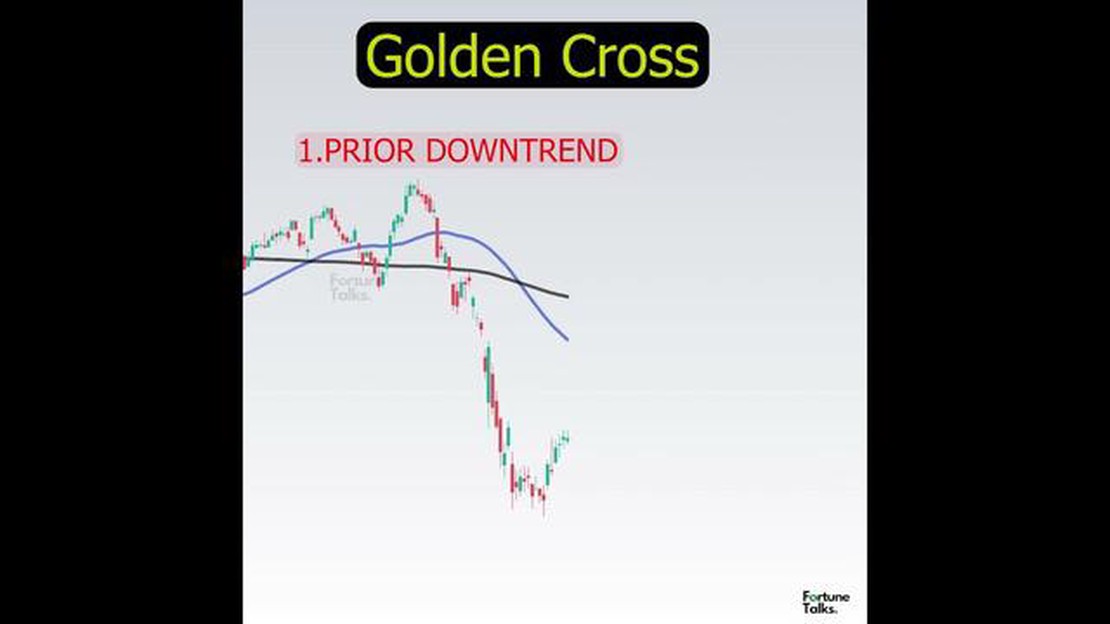
The Golden Cross is a popular technical analysis indicator used by traders and investors to predict bullish trends in the stock market. It is often mentioned in financial news and publications, but there is some confusion about whether it is based on the Exponential Moving Average (EMA) or the Simple Moving Average (SMA).
In simple terms, the Golden Cross occurs when a shorter-term moving average crosses above a longer-term moving average. This crossover is seen as a bullish signal, indicating that the stock or index is likely to continue its upward trend. However, the specifics of which moving averages to use can vary depending on the trader or analyst.
Some traders prefer to use the SMA, which calculates the average price over a specific period and gives equal weight to each data point. Others prefer to use the EMA, which gives more weight to recent prices, potentially making it more responsive to changes in market conditions.
Both the EMA and SMA can be used to identify Golden Crosses, and different traders may have different preferences based on their individual trading strategies. Ultimately, the choice between the two moving averages depends on the trader’s personal preference and the specific market conditions they are analyzing.
Key Takeaway: The Golden Cross is a technical indicator used to predict bullish trends. It can be based on either the EMA or the SMA, depending on the trader’s preference. Both moving averages have their advantages, and the specific choice depends on the individual trader and market conditions.
In the context of the Golden Cross, the Exponential Moving Average (EMA) and Simple Moving Average (SMA) are two different types of moving averages that are used to identify trends in stock prices or other financial assets. While they both have similar purposes, they differ in their calculation methods and responsiveness to price changes.
The SMA is calculated by taking the arithmetic mean of a specified number of price points over a given period of time. For example, a 50-day SMA would involve adding up the closing prices of the last 50 days and dividing the sum by 50. This simple method gives equal weight to all data points in the calculation, resulting in a smoother line that responds more slowly to recent price changes.
On the other hand, the EMA places more weight on recent price data and reacts faster to price changes. It is calculated using a formula that gives more weight to the most recent price points. The EMA is more responsive to short-term price movements, making it a useful tool for traders who need to react quickly to market changes. However, its responsiveness can also lead to increased volatility and false signals.
When it comes to the Golden Cross, both the EMA and SMA can be used. The Golden Cross is a bullish signal that occurs when a shorter-term moving average crosses above a longer-term moving average. Usually, the 50-day moving average is used as the shorter-term average, while the 200-day moving average is used as the longer-term average. Traders often look for a Golden Cross as a confirmation of an upward trend and a possible buying opportunity.
In conclusion, the main difference between EMA and SMA in the Golden Cross is their calculation methods and responsiveness to price changes. The SMA provides a smoother line that responds more slowly to recent price changes, while the EMA is more responsive to short-term price movements. Traders can choose between the two based on their trading style and time horizon.

| EMA | SMA |
|---|---|
| Calculated using a formula that gives more weight to recent price data. | Calculated by taking the arithmetic mean of price points over a specified period of time. |
| More responsive to short-term price movements. | Responds more slowly to recent price changes. |
| Can lead to increased volatility and false signals. | Provides a smoother line but may lag behind in signaling trend changes. |
The Golden Cross is a popular trend-following indicator used in technical analysis. It occurs when a short-term moving average crosses above a long-term moving average, signaling a potential bullish trend reversal or the start of a new bullish trend. It is considered as a bullish signal and can be used by traders to initiate long positions.
There are two types of moving averages commonly used in the calculation of the Golden Cross - the Exponential Moving Average (EMA) and the Simple Moving Average (SMA). Both types of moving averages can be used, depending on the trader’s preference and trading strategy.
The EMA assigns greater weight to recent data points, making it more responsive to price changes. This can result in faster moving average crossovers and potentially earlier signals. On the other hand, the SMA gives equal weight to all data points in the moving average calculation, resulting in a smoother and slower-moving average.
Read Also: Understanding the Binary Option Trading System: How it Works and How to Get Started
Traders often use the Golden Cross as a confirmation tool, looking for additional signals or indicators to support the trend reversal or the start of a new bullish trend. It is important to note that the Golden Cross is not a guaranteed trading signal and should be used in conjunction with other analysis techniques and risk management strategies.
In conclusion, the Golden Cross is a technical indicator that can help traders identify potential bullish trends in the market. Whether using the EMA or SMA, it is important to carefully analyze the overall market conditions and consider other factors before making trading decisions based on the Golden Cross.
Read Also: Step-by-Step Guide: How to Withdraw Money from Qartal FX
The Exponential Moving Average (EMA) is a type of moving average that gives more weight to recent data points. It is calculated by applying a weightage to each data point based on its relative position in the data set.
The EMA is commonly used in technical analysis to identify trends and generate trading signals. It is preferred by many traders because it reacts more quickly to price changes compared to the Simple Moving Average (SMA).
To calculate the EMA, you need to specify a time period, which determines the length of the moving average. The formula for calculating the EMA is more complex compared to the SMA:
The EMA is plotted on a chart as a line that represents the average price over the specified time period. Traders analyze the EMA to determine the direction of the trend and to identify potential support and resistance levels.

Overall, the EMA is a popular technical indicator that provides a smoother and more responsive representation of price movements compared to the SMA.
The Golden Cross is a technical analysis chart pattern that occurs when a short-term moving average crosses above a long-term moving average. It is considered a bullish signal and is often used by traders to identify buy opportunities in the market.
The Golden Cross can be calculated using either the Exponential Moving Average (EMA) or the Simple Moving Average (SMA). Both methods are commonly used by traders, and the choice between the two depends on personal preference and trading strategy.
The Golden Cross using EMA is calculated when the shorter-term EMA, such as the 50-day EMA, crosses above the longer-term EMA, such as the 200-day EMA. This crossover is considered to be a bullish signal and suggests that the price of the asset is likely to continue rising in the short term.
There is no definitive answer to this question as it ultimately depends on individual trading preferences. Some traders prefer the EMA because it places more weight on recent price data, while others prefer the SMA as it smoothes out price fluctuations. It is recommended to test both methods and choose the one that works best for your trading strategy.
Yes, the Golden Cross can be used for short-term trading. However, it is important to note that the Golden Cross is a lagging indicator and can generate false signals in choppy or volatile markets. It is always recommended to use the Golden Cross in conjunction with other technical indicators and analysis tools to increase the accuracy of your trading decisions.
The Golden Cross is a technical analysis pattern that occurs when a short-term moving average (such as the 50-day moving average) crosses above a long-term moving average (such as the 200-day moving average).
The Golden Cross can be based on either exponential moving averages (EMAs) or simple moving averages (SMAs). Both EMAs and SMAs can be used to calculate moving averages, so it depends on the trader’s preference.

STP Broker: What Type Is It? Straight Through Processing (STP) is a method used in the financial industry to electronically process transactions …
Read Article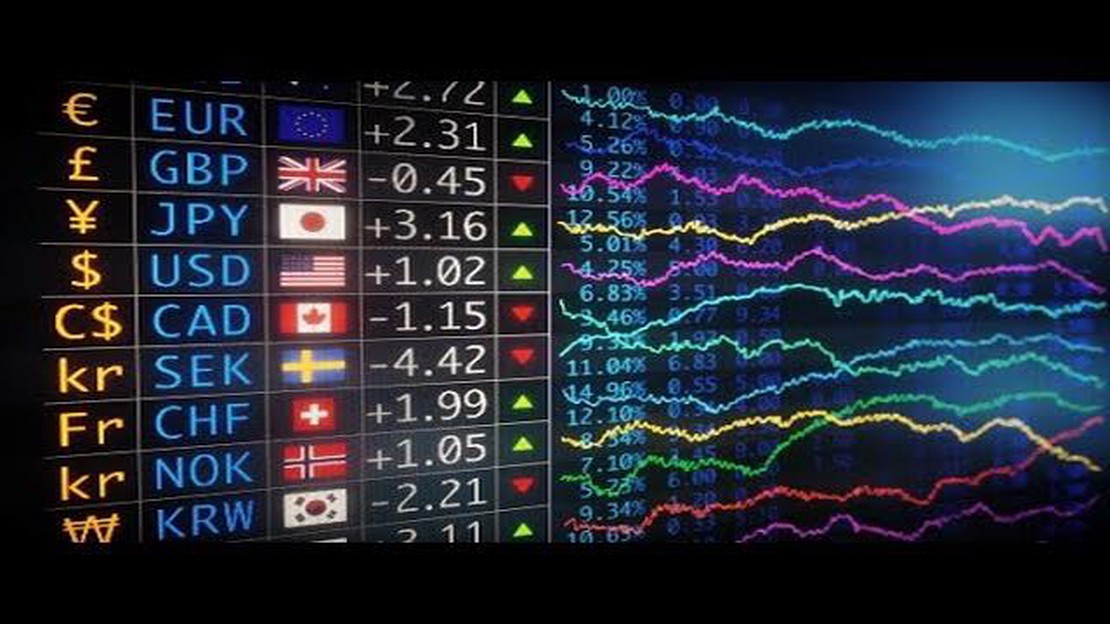
Where to see exchange rates on the stock exchange? When it comes to investing in stocks and currencies, having access to up-to-date exchange rates is …
Read Article
Understanding Options, Futures, and Other Derivatives Options, futures, and other derivatives are complex financial instruments that allow investors …
Read Article
What does ZMK stand for? ZMK is an acronym that stands for Zambian Kwacha. The Zambian Kwacha is the official currency of Zambia, a landlocked country …
Read Article
What are Employee Stock Options Worth? Employee stock options are becoming an increasingly popular form of compensation for employees at companies of …
Read Article
What occurs during a swap? Swaps are a popular financial instrument used by individuals and companies to manage risks and optimize their financial …
Read Article


