Best SuperTrend Indicator for MT4: Top Picks and Tips
Are you looking for the perfect SuperTrend indicator to enhance your trading strategy? Look no further! In this article, we will guide you through the top SuperTrend indicators available for MT4 and help you find the best one for your trading style.
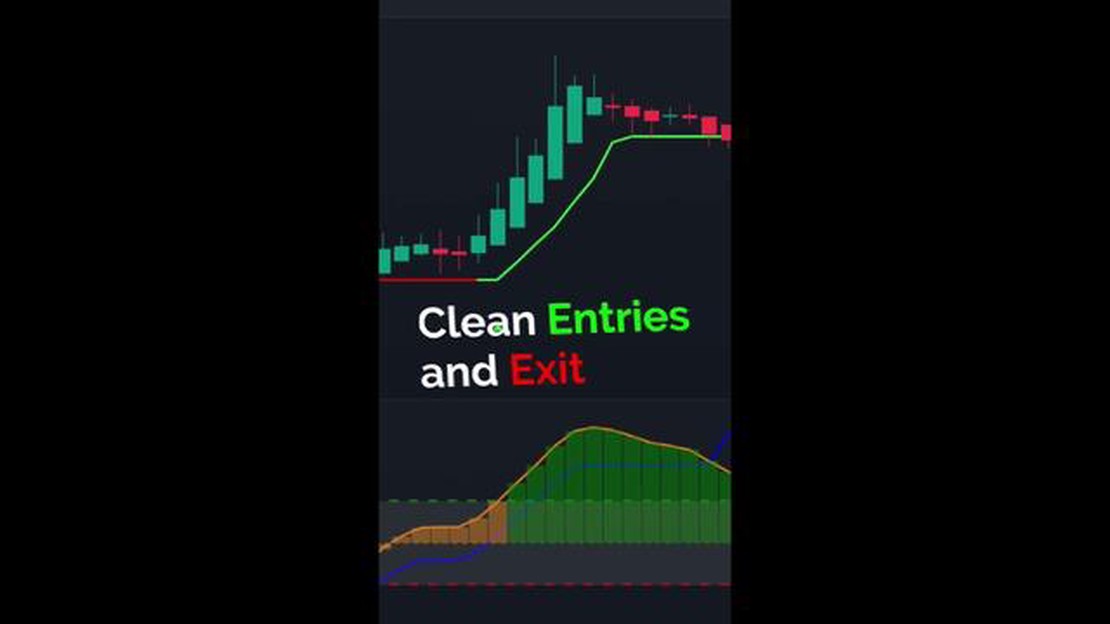
The SuperTrend indicator is a popular tool among traders, thanks to its ability to accurately identify trend directions and provide reliable entry and exit signals. It is based on the average true range (ATR) and calculates the trend by plotting a line above or below the price. When the price crosses the SuperTrend line, it indicates a potential change in trend direction, making it a valuable tool for both trend-following and counter-trend strategies.
Table Of Contents
There are numerous SuperTrend indicators available for MT4, each with its own unique features and parameters. Some indicators may be better suited for scalping strategies, while others may work well for swing trading or long-term investing. It is important to consider your trading goals, risk appetite, and preferred time frame when choosing a SuperTrend indicator.
To help you make an informed decision, we have compiled a list of the top SuperTrend indicators for MT4. We will discuss the key features of each indicator, including its formula, parameters, and customization options. Whether you are a beginner or an experienced trader, this article will provide you with the necessary information to choose the best SuperTrend indicator for your trading strategy.
What is the SuperTrend Indicator?
The SuperTrend indicator is a popular technical analysis tool used by traders to identify trends in the financial markets. It is a trend-following indicator that helps traders determine the direction of the market and the best time to enter or exit trades.
The SuperTrend indicator is based on the concept of “trend” and “volatility”. It uses two parameters: the period or length of the indicator and the multiplier. The period represents the number of bars or periods used to calculate the indicator, while the multiplier adjusts the indicator’s sensitivity to price changes.
The SuperTrend indicator is plotted on the price chart and consists of two lines: the SuperTrend line and the signal line. The SuperTrend line is the main line and represents the overall trend of the market. It is calculated by adding or subtracting the product of the multiplier and the average true range (ATR) from the previous period’s closing price. The signal line, on the other hand, is usually a simple moving average (SMA) of the SuperTrend line and helps traders identify trend reversals.
When the SuperTrend line is below the price and the signal line, it indicates an uptrend, and traders should consider buying or holding long positions. Conversely, when the SuperTrend line is above the price and the signal line, it indicates a downtrend, and traders should consider selling or holding short positions. The indicator also provides potential support and resistance levels, where traders can set their stop-loss and take-profit orders.
The SuperTrend indicator works well in trending markets, but it may generate false signals in sideways or choppy markets. Traders should use the indicator in conjunction with other technical analysis tools and indicators to confirm signals and improve their trading decisions. It is also important to adjust the parameters of the SuperTrend indicator to suit the specific market and time frame being traded.
In conclusion, the SuperTrend indicator is a powerful tool for identifying trends and making trading decisions. It helps traders stay on the right side of the market and maximize profit potential. However, like any technical analysis tool, it is not foolproof and should be used in conjunction with other analysis techniques for better results.
The Importance of SuperTrend Indicator in Trading
The SuperTrend indicator is a popular technical analysis tool used by traders to identify trends in the financial markets. It is based on the concept of price action and is used to generate buy and sell signals.
One of the key advantages of using the SuperTrend indicator is its ability to adapt to changing market conditions. Unlike other indicators that use fixed parameters, the SuperTrend indicator adjusts its settings based on market volatility. This means that it can provide more accurate signals in highly volatile markets and avoid false signals in less volatile markets.
The SuperTrend indicator also helps traders to identify the direction of the trend. It plots a line on the chart that represents the average price over a given period of time. If the price is above the line, it indicates an uptrend, and if the price is below the line, it indicates a downtrend. This information can be used to determine whether to enter or exit a trade.
Another important benefit of using the SuperTrend indicator is its simplicity. It is easy to understand and can be used by traders of all experience levels. The signals it generates are clear and easy to interpret, which makes it a popular choice among both beginners and experienced traders.
In addition to its simplicity, the SuperTrend indicator is also versatile. It can be used on any financial instrument and time frame, making it suitable for various trading strategies. Whether you are a day trader, swing trader, or long-term investor, the SuperTrend indicator can be a valuable tool in your trading arsenal.
In conclusion, the SuperTrend indicator is an important tool for traders looking to identify trends and generate buy and sell signals. Its ability to adapt to changing market conditions, its simplicity, and its versatility make it a valuable asset in any trader’s toolbox.
The SuperTrend indicator is a popular tool used by traders to identify trends in the financial markets. It is a versatile indicator that can be applied to various trading strategies. In this article, we will introduce you to some of the top SuperTrend indicators available for MT4.
1. SuperTrend Indicator
The SuperTrend Indicator is a classic SuperTrend indicator that is widely used by traders. It provides clear buy and sell signals based on the direction of the trend. The indicator is easy to understand and can be used on any time frame.
2. SuperTrend MTF
The SuperTrend MTF (Multi-Time Frame) indicator is designed to provide trend analysis on multiple time frames. Traders can use this indicator to identify the overall trend on higher time frames and then use lower time frames for precise entries and exits. This indicator is particularly useful for swing trading strategies.
The SuperTrend UFX indicator is a modified version of the original SuperTrend indicator. It provides additional features such as a trailing stop loss and customizable colors. This indicator is suitable for traders who want more control over their trades and want to adjust the indicator to their specific needs.
4. SuperTrend ATR
The SuperTrend ATR indicator is a variation of the SuperTrend indicator that takes into account the average true range (ATR) of the market. This indicator adjusts the stop loss level dynamically based on market volatility, which can help traders avoid getting stopped out during periods of high volatility.
5. SuperTrend CCI
The SuperTrend CCI indicator combines the SuperTrend indicator with the Commodity Channel Index (CCI) oscillator. This indicator helps traders identify overbought and oversold conditions in the market, which can be useful for timing entries and exits.
These are just a few examples of the top SuperTrend indicators available for MT4. Depending on your trading style and strategy, you may find different indicators more suitable for your needs. It’s important to test and experiment with different indicators to find the one that works best for you.
Remember, no indicator or strategy is foolproof, and it’s important to combine technical analysis with other tools and techniques to make informed trading decisions.
FAQ:
What is the SuperTrend Indicator?
The SuperTrend Indicator is a popular technical analysis tool that helps traders identify the direction of a trend and potential entry and exit points in the market.
How does the SuperTrend Indicator work?
The SuperTrend Indicator is based on the concept of average true range (ATR) and volatility. It plots a line above or below the price chart, indicating the current trend direction. When the line is below the price, it suggests an uptrend, and when the line is above the price, it suggests a downtrend.
Are there different versions of the SuperTrend Indicator for MT4?
Yes, there are several versions of the SuperTrend Indicator available for MT4. Some popular versions include the SuperTrend ATR, SuperTrend MTF, and SuperTrend with Sound Alert.
How can I choose the best SuperTrend Indicator for my trading strategy?
Choosing the best SuperTrend Indicator for your trading strategy depends on your specific requirements and preferences. You can consider factors such as customization options, additional features like sound alerts or multi-timeframe analysis, and user reviews to make an informed decision.
Can the SuperTrend Indicator be used for different trading styles?
Yes, the SuperTrend Indicator can be used for different trading styles, including day trading, swing trading, and long-term investing. It can help traders identify trends and potential entry and exit points regardless of their trading style.
What is the SuperTrend indicator?
The SuperTrend indicator is a popular technical analysis tool used by traders to identify the direction of a market trend. It is based on the concept of average true range (ATR) and calculates a dynamic line that follows the price movement. The indicator can be used to generate trading signals and determine stop-loss levels.
How does the SuperTrend indicator work?
The SuperTrend indicator works by calculating the average true range (ATR) and multiplying it by a multiplier value to determine the distance of the trend line from the price. The trend line is placed above the price in an uptrend and below the price in a downtrend. When the price crosses the trend line, it signals a potential change in the trend direction.
Top YouTube channels for forex trading Forex trading has become increasingly popular in recent years, with individuals from all walks of life looking …
Exploring the Trading Empire of the Mapungubwe The Mapungubwe Trading Empire was a renowned civilization that thrived in Southern Africa from the 9th …