

Learn the Best CFD Day Trading Strategy for Maximizing Profits
CFD Day Trading Strategy Explained When it comes to trading Contracts for Difference (CFDs), having a well-defined day trading strategy is essential …
Read Article

When it comes to trading, having the right tools and strategies can make all the difference between success and failure. One popular tool that many traders use is the Relative Strength Index (RSI) indicator. The RSI is a momentum oscillator that measures the speed and change of price movements. By understanding how to effectively use the RSI indicator, traders can gain valuable insights into market trends and make more informed trading decisions.
One of the key benefits of the RSI indicator is its ability to identify overbought and oversold conditions. When the RSI value is above 70, it suggests that the market is overbought and a potential reversal or correction may occur. Conversely, when the RSI value is below 30, it indicates that the market is oversold and a potential rebound may be imminent. By using the RSI to identify these extreme market conditions, traders can better time their entry and exit points, increasing their chances of making profitable trades.
Another useful application of the RSI indicator is its ability to generate divergence signals. Divergence occurs when the RSI indicator moves in the opposite direction of price movement. This can indicate a potential reversal in the trend and provide traders with an opportunity to enter a trade in the opposite direction. By paying attention to divergence signals, traders can catch trend reversals early and capitalize on them.
It’s important to note that while the RSI indicator can be a valuable tool, it should not be used in isolation. Traders should always consider other technical indicators, as well as fundamental and sentimental analysis, to confirm their trading decisions. Additionally, it’s crucial to use proper risk management techniques and set stop-loss orders to minimize potential losses. By combining the RSI indicator with other tools and strategies, traders can enhance their trading performance and increase their chances of success.

The Relative Strength Index (RSI) is a popular technical indicator used in trading to assess the strength and momentum of a financial instrument. It was developed by J. Welles Wilder in the late 1970s and remains widely used by traders and analysts today.
The RSI is a bounded oscillator that ranges between 0 and 100. It is calculated based on the average gain and loss over a specified time period, usually 14 periods. The RSI is plotted as a line on a chart, with readings above 70 indicating overbought conditions and readings below 30 indicating oversold conditions.
The RSI indicator can provide traders with valuable insights into market conditions. By understanding how to interpret the RSI, traders can identify potential trend reversals and gauge the strength of price movements.
Read Also: Understanding Vanilla Options: Definition, Features, and Benefits
For example, if the RSI is above 70, it suggests that the instrument may be overbought and due for a price correction. Conversely, if the RSI is below 30, it indicates that the instrument may be oversold and due for a price rebound.
Additionally, divergences between price and the RSI can provide important trading signals. For instance, if the price of an instrument is making higher highs while the RSI is making lower highs, it may indicate a bearish divergence and a potential trend reversal to the downside. In contrast, if the price is making lower lows while the RSI is making higher lows, it may indicate a bullish divergence and a potential trend reversal to the upside.
Traders should be aware that the RSI is not a standalone indicator and should be used in conjunction with other technical analysis tools and indicators for more accurate trading decisions. It is also important to consider the timeframe being analyzed as shorter timeframes may result in more frequent RSI signals.
In conclusion, the RSI is a useful tool for traders looking to assess the strength and momentum of a financial instrument. By understanding how to interpret the RSI and using it in conjunction with other indicators, traders can make more informed trading decisions and potentially improve their trading results.
The Relative Strength Index (RSI) is a popular technical indicator used by traders to determine potential overbought or oversold conditions in a security. It measures the speed and change of price movements and can be applied to various trading strategies.
Here are some ways to apply the RSI indicator in trading:
Read Also: Understanding 0DTE Options on Etrade: Everything You Need to Know
It is important to note that while the RSI indicator can be a useful tool in trading, it should not be used in isolation. It is recommended to use the RSI in conjunction with other technical indicators, chart patterns, and fundamental analysis to make well-informed trading decisions.
The RSI indicator, or Relative Strength Index, is a popular technical analysis tool used by traders to measure the strength and speed of a price movement. It is an oscillator that ranges from 0 to 100 and is typically used to identify overbought and oversold conditions in the market.
The RSI is calculated using the average of the up closes and the average of the down closes over a specific period of time. The formula is: RSI = 100 - (100 / (1 + RS)), where RS is the average of the up closes divided by the average of the down closes.

The RSI can be calculated over any period of time, but the most commonly used periods are 14 days or 9 days. These periods are considered to provide a good balance between responsiveness and reliability of the RSI signal.
When the RSI is above 70, it is considered overbought, which means the price may be due for a correction or reversal. When the RSI is below 30, it is considered oversold, which means the price may be due for a bounce or a rally. Traders can use these levels to identify potential entry or exit points.
No, the RSI should not be used as the sole indicator for making trading decisions. It is just one tool among many in a trader’s toolkit. It is best used in combination with other technical indicators and price action analysis to confirm signals and enhance the overall trading strategy.

CFD Day Trading Strategy Explained When it comes to trading Contracts for Difference (CFDs), having a well-defined day trading strategy is essential …
Read Article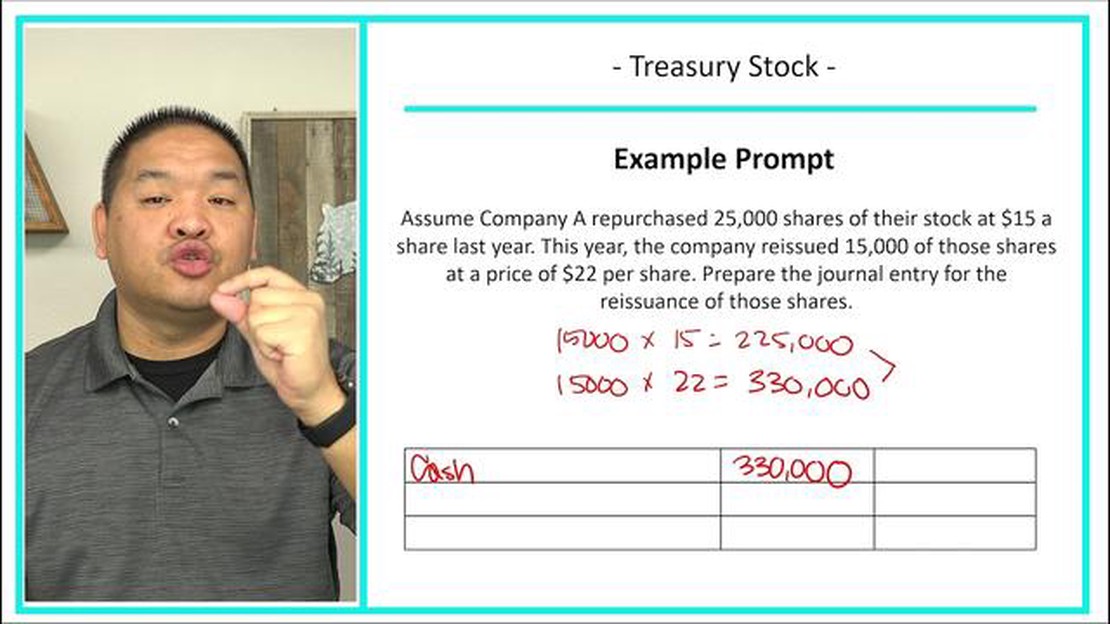
How to Record a Treasury Stock Reissuance Treasury stock reissuance is the process of selling back previously repurchased shares of a company’s stock. …
Read Article
How to Trade Non-Farm Payrolls (NFP) in Forex The Non-Farm Payrolls (NFP) report is one of the key economic indicators that traders eagerly await each …
Read Article
Simple steps to create an MT5 EA Trading in the financial markets can be a challenging and time-consuming task. However, with the help of technology, …
Read Article
Best Computers for Trading Stocks: A Comprehensive Guide When it comes to trading stocks, having the right computer can make all the difference. With …
Read Article
Will CAD Go Up in 2023? The Canadian dollar, also known as CAD, has been a subject of interest for investors and economists alike. As we approach …
Read Article


