


Trading Cryptocurrency in Sweden: Everything You Need to Know
Trading Cryptocurrency in Sweden: What You Need to Know In recent years, cryptocurrency has become a global phenomenon, attracting investors and …
Read Article
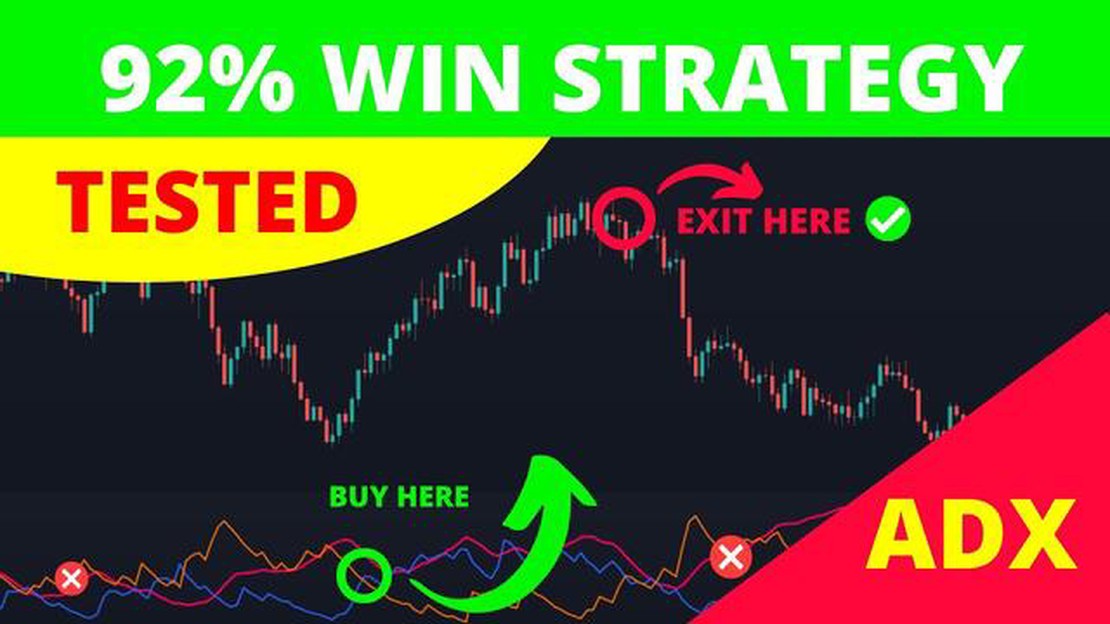
The Average Directional Index (ADX) is a popular technical indicator used by traders to determine the strength of a trend. It was developed by J. Welles Wilder Jr. and was first introduced in his book “New Concepts in Technical Trading Systems” in 1978.
The ADX indicator is based on the concept that the strength of a trend can be measured by analyzing the difference between positive and negative directional movements. The ADX line is calculated using a formula that takes into account the high, low, and close prices of the asset being analyzed.
Traders use the ADX indicator to identify whether a trend is strong or weak, as well as to spot potential trend reversals. A high ADX reading indicates a strong trend, while a low ADX reading suggests a weak or consolidation phase in the market.
When the ADX line is above 25, it is considered a sign of a strong trend. Traders can use this information to enter trades in the direction of the trend and stay in the trade as long as the ADX remains above this level. Conversely, when the ADX line is below 25, it indicates a weak trend, and traders may choose to avoid entering trades or consider taking profit on their existing positions.
It is important to note that the ADX indicator does not provide information about the direction of the trend; it only measures its strength. Therefore, it is often used in conjunction with other technical indicators and price analysis tools to confirm trade signals and make more informed trading decisions.
In conclusion, the ADX indicator is a valuable tool for traders looking to assess the strength of a trend. By understanding how to interpret ADX readings, traders can improve their chances of entering and staying in profitable trades. However, it is important to use the ADX in conjunction with other technical analysis tools to avoid false signals and increase the accuracy of trade setups.
The Average Directional Index (ADX) is a powerful indicator that can greatly enhance trading strategies. It is used to measure the strength and direction of a trend, helping traders to identify whether the market is trending or ranging.
One of the main benefits of using the ADX indicator is that it provides objective information about the trend’s strength, which can help traders make more informed decisions. Traders can use the ADX indicator to confirm the strength of a trend before entering a trade, which can reduce the likelihood of false signals and improve overall trading performance.
In addition to measuring trend strength, the ADX indicator can also be used to identify potential trend reversals. When the ADX line starts to decline after reaching a peak, it can signal that the trend is losing strength and a reversal may be imminent. This information can be used to exit trades or to take profit before the trend reverses.
Furthermore, the ADX indicator can be used in conjunction with other technical analysis tools to validate trade signals. For example, if a trader receives a bullish signal from a moving average crossover, they can use the ADX indicator to confirm that the trend is strong enough to enter a trade.
Traders should also pay attention to the ADX line in relation to the +DI and -DI lines. The +DI line measures buying pressure, while the -DI line measures selling pressure. When the ADX line is above both the +DI and -DI lines, it indicates a strong trend. Conversely, when the ADX line is below both the +DI and -DI lines, it indicates a weak trend or a ranging market.
Overall, the ADX indicator is a valuable tool for traders as it provides objective information about trend strength and direction. By incorporating the ADX indicator into their trading strategies, traders can make more accurate and profitable trading decisions.

One of the main reasons why the ADX indicator is so important for traders is because it helps them identify when a trend is strong enough to trade. The ADX indicator ranges from 0 to 100, with readings above 25 typically indicating a strong trend. Traders can use this information to enter trades in the direction of the trend, maximizing their chances of profitability.
Another reason why the ADX indicator is essential for traders is that it helps them determine when a trend is losing strength. When the ADX starts to decline from high levels, it indicates that the trend may be losing momentum. This can be an early warning sign for traders to consider exiting their positions or scaling back their exposure to the market.
Furthermore, the ADX indicator can also be used to identify potential trend reversals. When the ADX starts to rise after a period of consolidation or a weak trend, it indicates that a new trend may be forming. Traders can use this information to anticipate trend reversals and enter positions at the early stages of a new trend, increasing the potential for profit.
Overall, the ADX indicator is a must-have for traders because it provides valuable information about the strength of a trend. By using this indicator, traders can enter trades with higher probabilities of success, exit positions at the right time, and even anticipate trend reversals. Incorporating the ADX indicator into a trading strategy can greatly enhance a trader’s ability to navigate the markets and make profitable trades.
Read Also: Screening Forex Pairs: A Guide to Choosing the Right Currency Pairs for Trading
| ADX Indicator | Measure the strength of a trend |
| Trend Strength | Readings above 25 indicate a strong trend |
| Trend Reversals | Rising ADX after consolidation indicates a potential trend reversal |
The Average Directional Index (ADX) is a powerful tool that can help traders identify strong trends and determine the strength of a given trend. By understanding how to use the ADX indicator, traders can make informed decisions and increase their chances of successful trading.
1. Identifying Trend Direction:
To use the ADX indicator effectively, it is important to first identify the direction of the underlying trend. Traders can use other technical analysis tools such as moving averages or trend lines to determine the trend direction. Once the trend direction is identified as bullish or bearish, the ADX indicator can be used to gauge the strength of the trend.
Read Also: Understanding the Tax Implications: Do You Pay Capital Gains on Options Trading?
2. Assessing Trend Strength:
The ADX indicator consists of three lines: the ADX line, the +DI line, and the -DI line. The ADX line measures the strength of the trend, while the +DI and -DI lines measure the bullish and bearish components of the trend, respectively. Traders should pay close attention to the ADX line, as a rising ADX indicates a strengthening trend.
3. Confirming Trend Reversals:
In addition to identifying trend direction and strength, the ADX indicator can also help traders confirm trend reversals. When the ADX line starts to decline after reaching an overbought or oversold level, it may indicate that the current trend is losing strength and a reversal is likely. Traders can use this information to adjust their trading strategy accordingly.

4. Using ADX in Conjunction with Other Indicators:
While the ADX indicator can be powerful on its own, it is often more effective when used in conjunction with other technical analysis indicators. For example, traders may use the ADX indicator alongside other oscillators such as the Relative Strength Index (RSI) or the Moving Average Convergence Divergence (MACD) to obtain a more comprehensive view of the market.
5. Setting Appropriate Stop Loss and Take Profit Levels:
The ADX indicator can also be used to set appropriate stop loss and take profit levels. By understanding the strength of the trend, traders can determine the level of volatility in the market and set their stop loss and take profit levels accordingly. This can help traders minimize losses and maximize profits.
In conclusion, the ADX indicator is a valuable tool for traders looking to identify strong trends and determine the strength of a given trend. By incorporating the ADX indicator into their trading strategy and using it in conjunction with other technical analysis tools, traders can increase their chances of successful trading.
The ADX indicator, also known as the Average Directional Index, is a technical analysis tool used to determine the strength of a trend.
The ADX indicator is based on the calculation of the difference between the +DI and -DI lines. It measures the strength of the trend by comparing the movement in positive and negative directions.
A high ADX value indicates a strong trend. It suggests that the current trend is likely to continue and traders may consider looking for opportunities to join the trend.
Yes, the ADX indicator can be used for both bullish and bearish trends. In a bullish trend, a rising ADX value indicates increasing bullish strength, while in a bearish trend, a rising ADX value indicates increasing bearish strength.
Yes, there are limitations to the ADX indicator. It is a lagging indicator, which means it may not provide early signals for trend reversals. Additionally, it does not provide information about the direction of the trend, only the strength.

Trading Cryptocurrency in Sweden: What You Need to Know In recent years, cryptocurrency has become a global phenomenon, attracting investors and …
Read Article
Who uses forex? The foreign exchange market, also known as Forex, is the largest and most liquid financial market in the world. It involves the buying …
Read Article
Determining the Value of a Stock Option: A Comprehensive Guide Understanding the true value of a stock option is crucial for investors looking to make …
Read Article
Understanding the Difference between Sell to Open and Sell to Close Stock Options When it comes to trading stock options, two common strategies that …
Read Article
Choosing the Most Affordable VPS Service for Forex Trading Are you a forex trader looking for a reliable and affordable Virtual Private Server (VPS) …
Read Article
Understanding the Autoregressive Moving Average Process If you’re interested in time series analysis and forecasting, you’ve likely come across the …
Read Article


