


Which Currency Does Florida Use? Exploring the Currency System in the Sunshine State
What Currency is Used in Florida? Florida, known as the Sunshine State, is not only a popular tourist destination but also an economic hub. As a part …
Read Article
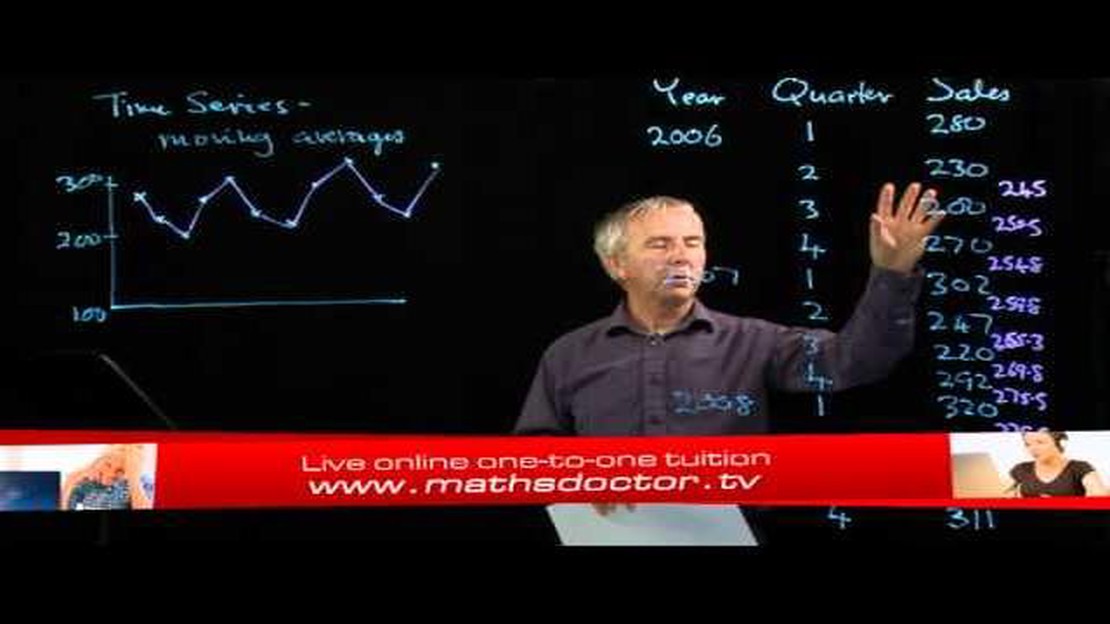
When analyzing time series data, moving averages are an important tool. They are commonly used to smooth out the noise in the data and identify trends or patterns. Moving averages are calculated by taking the average of a certain number of data points over a specific period of time.
There are several types of moving averages that vary in terms of how they are calculated and the weight given to different data points. The most commonly used types include the simple moving average (SMA), exponential moving average (EMA), weighted moving average (WMA), and triangular moving average (TMA).
The SMA is the simplest form of moving average and is calculated by taking the average of a fixed number of data points over a certain time period. The EMA, on the other hand, gives more weight to recent data points, making it more responsive to changes in the data. The WMA assigns different weights to each data point, giving more importance to certain data points over others. The TMA is a weighted moving average that places greater emphasis on the most recent data points.

Moving averages are widely used in technical analysis to identify trends, support and resistance levels, and entry/exit points for trading. They can be applied to a variety of time series data, including stock prices, economic indicators, and climate data. Understanding the different types of moving averages and how they are calculated is crucial for accurate analysis and interpretation of time series data.
Simple Moving Averages (SMA) are one of the most commonly used technical indicators in time series analysis. They provide a smoothed representation of the underlying data by calculating the average value over a specified period of time.
The SMA is calculated by adding up the closing prices of the selected time period and dividing the sum by the number of periods. This average is then plotted on a chart as a line, which can help analysts identify trends and patterns in the data.
There are several applications of SMAs in time series analysis:
While SMAs are useful in many situations, it is important to note that they are based on historical data and may not always accurately predict future trends. To gain a more comprehensive understanding of the data, it is often beneficial to combine SMAs with other technical indicators and analysis techniques.
An exponential moving average (EMA) is a type of moving average that places more weight on the most recent data points. Unlike the simple moving average (SMA), which assigns equal weight to all data points, the EMA gives more significance to recent data.
Read Also: What is the average conveyancing fee in the UK? Find out here
The EMA is calculated using a formula that adjusts the weight assigned to each data point based on its age. The most recent data points are given the highest weight, while older data points receive progressively lower weights. This weighting scheme allows the EMA to respond more quickly to changes in the underlying data.
There are several advantages to using exponential moving averages:
Read Also: Understanding the Significance of a Golden Cross in Stocks
It’s important to note that the EMA is not a standalone indicator and should be used in conjunction with other technical analysis tools. Additionally, the choice between using a simple moving average or an exponential moving average depends on the specific trading strategy and the time frame being analyzed.
A moving average is a statistical calculation used to analyze time series data. It is a simple average of a set of data points over a specified period of time, where the average is updated as new data becomes available.
There are several types of moving averages, including the simple moving average (SMA), the exponential moving average (EMA), the weighted moving average (WMA), and the triangular moving average (TMA).
A simple moving average is calculated by taking the average of a set of data points over a specified period of time. Each data point in the set is given equal weight in the calculation.
The main difference between a simple moving average and an exponential moving average is that an exponential moving average gives more weight to recent data points. This means that an EMA reacts more quickly to price changes, while an SMA responds more slowly.
Moving averages can be used in time series analysis to smooth out short-term fluctuations and identify trends or patterns in the data. They can also be used as a tool for making predictions or forecasting future values.

Moving averages in time series are statistical tools used to analyze the trend and pattern of a dataset over a certain period of time. They smooth out the noise and fluctuations in the data, providing a clearer picture of the underlying trend.
A simple moving average (SMA) is the most basic type of moving average. It is calculated by taking the average of a fixed number of data points over a given time period. The SMA gives equal weight to all the data points in the time period and is useful for identifying long-term trends.

What Currency is Used in Florida? Florida, known as the Sunshine State, is not only a popular tourist destination but also an economic hub. As a part …
Read Article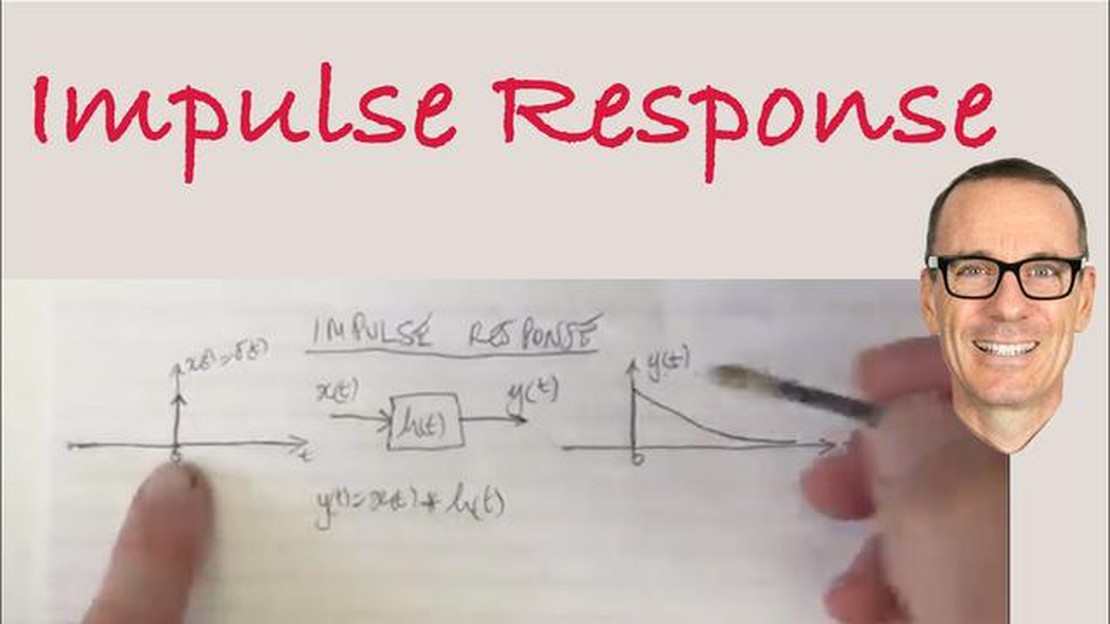
Understanding Impulse Response Function in Time Series Analysis Impulse response functions (IRFs) are a fundamental tool in time series analysis. They …
Read Article
Understanding the Value of Forex and Its Significance The foreign exchange market, commonly known as Forex, plays a vital role in the global economy. …
Read Article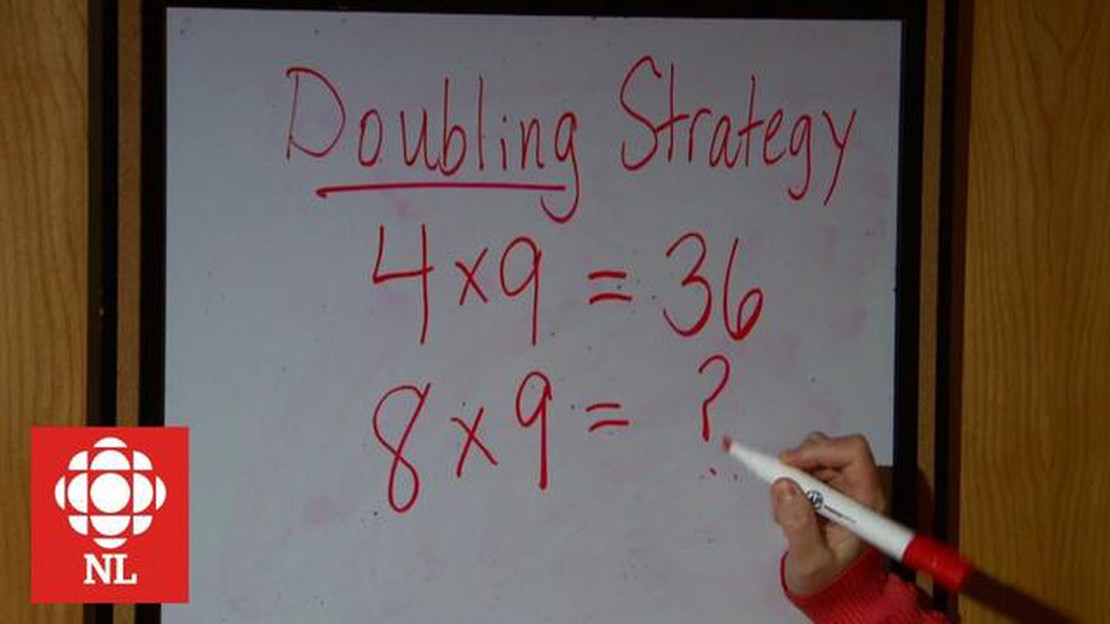
Using the Doubling Method in Mathematics The doubling method is a powerful technique that can greatly improve your ability to learn new skills and …
Read Article
Best Places to Exchange Money in Helsinki Planning a trip to Helsinki and wondering where to exchange your currency? Look no further! In this article, …
Read Article
Is forex riskier than stocks? When it comes to investing, many people wonder whether Forex or stocks are riskier. Both markets have their own unique …
Read Article


