


Unlocking the Potential of Bollinger Bands: Strategies for Optimal Use
The Best Use of Bollinger Bands: A Comprehensive Guide Bollinger Bands are a popular technical analysis tool used by traders to identify potential buy …
Read Article
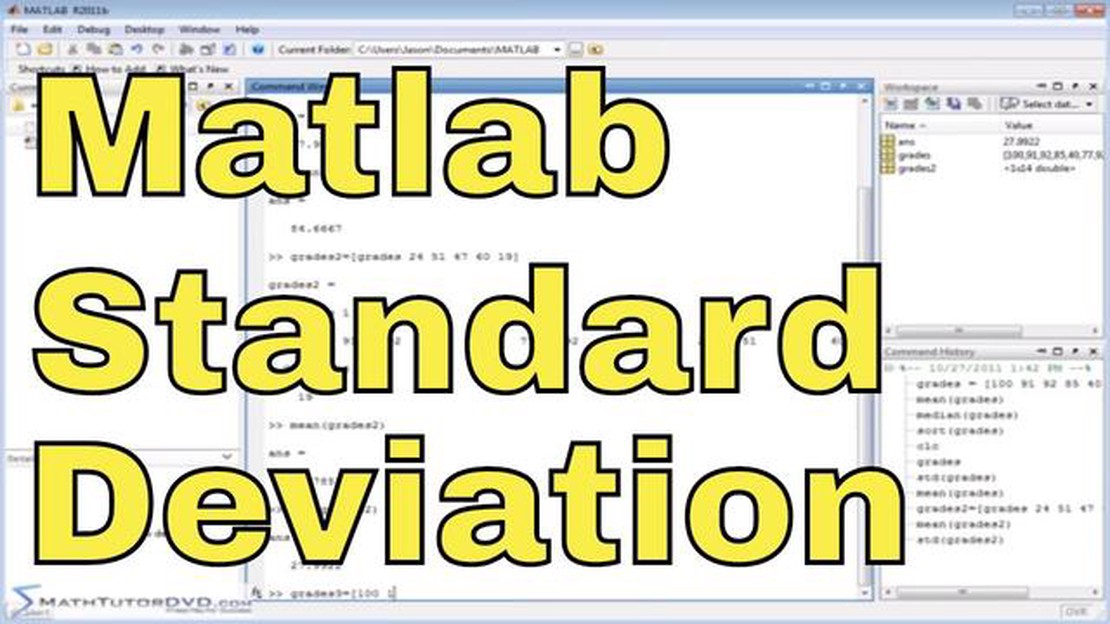
Calculating the standard deviation is a common task in data analysis and statistics. It provides a measure of the variability or spread of a dataset. Matlab, a powerful programming language, offers several methods to calculate the standard deviation of a dataset. In this article, we will walk you through the step-by-step guide on how to calculate the standard deviation using Matlab.
Step 1: Inputting the Dataset
The first step is to input the dataset into Matlab. You can either manually input the data or load it from an external file. For example, if your dataset contains 10 numbers, you can create a vector in Matlab using the following code:
data = [1, 3, 5, 7, 9, 11, 13, 15, 17, 19];
Step 2: Calculating the Mean
Next, you need to calculate the mean of the dataset. The mean is the sum of all the numbers divided by the total number of values. In Matlab, you can use the following code to calculate the mean:
mean_value = mean(data);
Step 3: Calculating the Deviation
After calculating the mean, you need to find the deviation of each data point from the mean. This can be done by subtracting the mean from each data point. In Matlab, you can use the following code to calculate the deviation:
deviation = data - mean_value;
Step 4: Calculating the Squared Deviation
Once you have the deviation for each data point, you need to calculate the squared deviation. This is done by squaring each deviation. In Matlab, you can use the following code:
squared_deviation = deviation.^2;
Step 5: Calculating the Variance
The next step is to calculate the variance, which is the average of the squared deviations. In Matlab, you can use the following code:
variance = mean(squared_deviation);
Step 6: Calculating the Standard Deviation
Finally, you can calculate the standard deviation by taking the square root of the variance. In Matlab, you can use the following code:
standard_deviation = sqrt(variance);

By following these steps, you can easily calculate the standard deviation of a dataset using Matlab. This information can be valuable for analyzing and interpreting data in various fields such as finance, engineering, and research.
Standard deviation is a statistical measure that quantifies the amount of variation or dispersion in a set of values. In Matlab, calculating the standard deviation of data can be done using built-in functions and methods.
To calculate the standard deviation of a dataset, you can follow these steps:
Step 1: Prepare your data by storing it in a variable or array. Make sure your data is in the correct format, such as a vector or a matrix.
Read Also: Is MetaTrader a Good Choice for Trading? Exploring the Benefits and Drawbacks
Step 2: Use the built-in function “std” to calculate the standard deviation. The “std” function takes your data as input and returns the standard deviation.
Example:
Read Also: Who can trade on EEX? Find out who is eligible to trade on the European Energy Exchange
data = [3, 6, 9, 12, 15];standard_deviation = std(data);disp(standard_deviation);
The output will be the standard deviation of the dataset. In this example, the standard deviation is approximately 4.47.
Step 3: You can also calculate the standard deviation of a specific dimension in a matrix using the “std” function with additional arguments. For example, to calculate the standard deviation along the rows of a matrix, you can use the syntax “std(data, 0, 1)”.
Example:
data = [1, 2, 3; 4, 5, 6; 7, 8, 9];standard_deviation_rows = std(data, 0, 1);disp(standard_deviation_rows);
The output will be the standard deviation along the rows of the matrix. In this example, the standard deviations are approximately [2.45, 2.45, 2.45].

Step 4: If you want to calculate the standard deviation along the columns of a matrix, you can use the syntax “std(data, 0, 2)”.
Example:
data = [1, 2, 3; 4, 5, 6; 7, 8, 9];standard_deviation_columns = std(data, 0, 2);disp(standard_deviation_columns);
The output will be the standard deviation along the columns of the matrix. In this example, the standard deviations are approximately [0.82, 0.82, 0.82].
By following these steps, you can easily calculate the standard deviation of your data in Matlab. Standard deviation is a useful tool for understanding the spread or variability of data, and it can provide valuable insights in various fields such as finance, engineering, and scientific research.
Before calculating the standard deviation in Matlab, the first step is to import the data into the program. Matlab provides several methods to import data, depending on the file format and structure of the data.
One common method is to import data from a text file using the importdata function. This function allows you to specify the delimiter used in the file, such as comma or tab, and automatically generates a table or matrix based on the contents of the file.
Another method is to import data from a spreadsheet file using the xlsread function. This function allows you to specify the sheet name, range, and other options to import the desired data. The data is then stored in a matrix or cell array.
If the data is in a different format, such as a database or CSV file, Matlab provides additional functions to import data, such as sqlread or readtable.
Once the data is imported into Matlab, it can be assigned to a variable for further analysis and calculations, including calculating the standard deviation.
| Function | Description |
|---|---|
importdata | Imports data from a text file |
xlsread | Imports data from a spreadsheet file |
sqlread | Imports data from a database |
readtable | Imports data from a CSV file or Excel worksheet |
Standard deviation is a measure of the amount of variation or dispersion in a set of values. It measures how far each value in the set is from the mean.
Standard deviation is important in statistics because it provides a measure of how spread out the values in a data set are around the mean. It helps to understand the variability and distribution of the data.
To calculate standard deviation in Matlab, you can use the built-in function std() in combination with specifying the dimension along which you want to calculate the standard deviation. For example, if you have a matrix M and want to calculate the standard deviation along the rows, you can use std(M, 0, 1).
The output of the std() function in Matlab represents the standard deviation of the values in the input data. It is a single value that indicates the dispersion of the data set.
No, standard deviation cannot be negative. It is always a non-negative value, as it represents a measure of spread or dispersion.
Standard deviation is a measure of variability or dispersion of a set of values. It indicates how much the values deviate from the mean.
Standard deviation is important because it provides information about the spread of data. It helps in understanding how close or how far the values are from the mean and provides a measure of uncertainty or risk.

The Best Use of Bollinger Bands: A Comprehensive Guide Bollinger Bands are a popular technical analysis tool used by traders to identify potential buy …
Read Article
Is MetaTrader 4 legal in Singapore? If you are a trader or investor in Singapore, you may be wondering whether using MetaTrader 4 (MT4) is legal in …
Read Article
Current exchange rate: How much is $100 US in Iraq? Curious about how much your USD can get you in Iraq? Stay updated with the latest exchange rate …
Read Article
Learn the Benefits of the 30-minute Chart for Traders If you are an active trader, you know how crucial it is to have real-time information and make …
Read Article
Advantages of Moving Average Method in Time Series Analysis The moving average method is a popular tool in time series analysis that allows for the …
Read Article
Can Directors Be Issued ESOPs? Employee Stock Ownership Plans (ESOPs) have long been a popular incentive tool for companies looking to reward their …
Read Article


