

Beginner's Guide: How to Start Trading in Pakistan?
Trading in Pakistan: A Step-by-Step Guide Trading in Pakistan has become increasingly popular among individuals looking to generate an additional …
Read Article
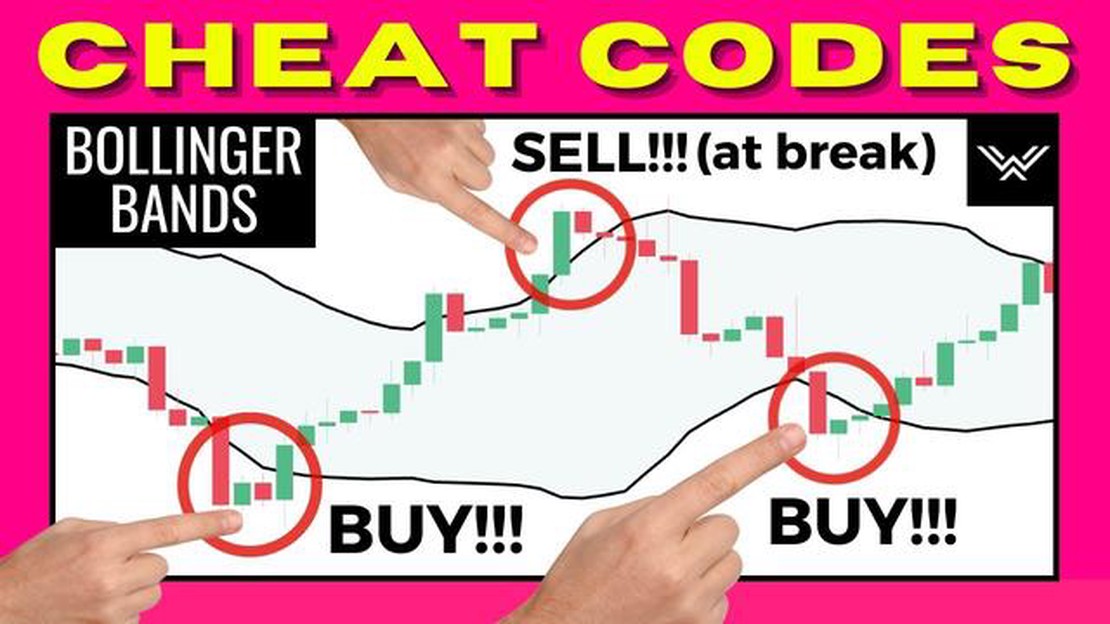
Bollinger Bands are a popular technical analysis tool used by traders to identify potential buy and sell signals in financial markets. Developed by John Bollinger in the 1980s, these bands consist of a middle band, which is a simple moving average, and an upper and lower band that represent the standard deviations of the price from the middle band. Understanding how to effectively utilize Bollinger Bands can greatly enhance a trader’s ability to make informed decisions and improve trading outcomes.
One of the key strategies for using Bollinger Bands is to identify periods of low volatility followed by periods of high volatility, as this often signifies potential trading opportunities. When the bands are relatively narrow, it indicates that the price is range-bound and there is lower volatility in the market. Traders can wait for a breakout above the upper band or below the lower band to enter a long or short position, respectively. This strategy works well in trending markets where price tends to break out and continue in the same direction.
Another strategy is to use Bollinger Bands in conjunction with other technical indicators to confirm trading signals. For example, if the price is touching the upper band and the relative strength index (RSI) is in overbought territory, it may be a signal to sell or take profits. Conversely, if the price is touching the lower band and the RSI is in oversold territory, it may be a signal to buy or enter a long position. Combining Bollinger Bands with other indicators can help filter out false signals and increase the probability of successful trades.
It is important to note that Bollinger Bands should not be used in isolation, but rather as part of a comprehensive trading strategy. Traders should also consider other factors such as market trends, support and resistance levels, and fundamental analysis before making trading decisions. Additionally, it is essential to set proper stop-loss and take-profit levels to manage risk and protect capital.
In conclusion, Bollinger Bands are a versatile technical analysis tool that can greatly assist traders in identifying potential buy and sell signals. By understanding how to interpret and apply these bands in conjunction with other indicators, traders can unlock the full potential of Bollinger Bands and improve their trading outcomes. However, it is important to remember that no trading strategy is foolproof, and proper risk management is crucial in order to achieve long-term success in the financial markets.
The purpose of Bollinger Bands is to provide a relative definition of high and low prices. They are used to identify periods of high volatility and low volatility, as well as to spot potential trend reversals.

The upper band is calculated by adding two standard deviations to the moving average, while the lower band is calculated by subtracting two standard deviations. The closer the price is to the upper band, the more overbought the market is considered, and the closer the price is to the lower band, the more oversold the market is considered.
Traders often use Bollinger Bands in conjunction with other technical indicators to confirm signals and improve the accuracy of their trades. For example, when the price touches the upper band and an oscillator like the Relative Strength Index (RSI) is overbought, it could be a signal to sell. On the other hand, when the price touches the lower band and the RSI is oversold, it could be a signal to buy.
| Advantages of Bollinger Bands | Disadvantages of Bollinger Bands |
|---|---|
| * Easy to calculate and interpret |
Read Also: How to Install a Premium WordPress Theme for Free
In conclusion, Bollinger Bands are a versatile tool that can help traders identify potential trading opportunities. They provide valuable information about price volatility and can be used in conjunction with other indicators for more accurate signals. However, they should not be relied upon as a standalone strategy and should be used in conjunction with other analysis techniques to confirm signals.
Bollinger Bands are a technical analysis tool that was developed by John Bollinger in the 1980s. They consist of a moving average line, an upper band, and a lower band. The moving average line is typically set to a 20-period moving average, and the upper and lower bands are set two standard deviations away from the moving average line.
These bands are used to define volatility and identify potential price reversals. When the price is trading within the bands, it is considered to be in a normal trading range. However, when the price moves towards the upper band, it indicates that the market is overbought, and when the price moves towards the lower band, it indicates that the market is oversold. This can help traders identify potential entry and exit points.
Additionally, Bollinger Bands can also be used to identify periods of low volatility. When the bands contract, it suggests that the market is consolidating and that a period of high volatility may be imminent. Conversely, when the bands expand, it suggests that volatility is increasing.
Read Also: Understanding the Concept of Intrinsic Value in Stock Options
Traders can use Bollinger Bands in a variety of ways, such as identifying trend reversals, determining stop-loss levels, and generating trading signals. It is important to note that Bollinger Bands should not be used as a standalone indicator, but rather in conjunction with other technical analysis tools and indicators to confirm signals.
In conclusion, Bollinger Bands are a versatile technical analysis tool that can help traders identify potential price reversals, define volatility, and generate trading signals. By understanding how they work and incorporating them into a comprehensive trading strategy, traders can unlock the full potential of Bollinger Bands.
Bollinger Bands are a technical analysis tool that consists of a middle band, an upper band, and a lower band. The middle band is typically a simple moving average, while the upper and lower bands are usually set at two standard deviations above and below the middle band. Traders use Bollinger Bands to assess volatility and identify potential turning points in the market. When the price touches the upper band, it may indicate that the market is overbought and due for a reversal, while touching the lower band may suggest the market is oversold. Traders also look for breakouts when the price moves outside the bands, which may signal a strong trend.

Yes, Bollinger Bands can be used in conjunction with other technical indicators to enhance trading signals. For example, some traders use Bollinger Bands alongside the Relative Strength Index (RSI) to confirm overbought or oversold conditions. If the price touches the upper band and the RSI is also at a high level, it may provide a stronger signal for a potential reversal. Traders can experiment with different combinations of indicators to find the most effective strategy that suits their trading style and objectives.
Bollinger Bands can be effective in various market conditions, but they tend to be particularly useful during periods of high volatility. When the market is experiencing increased price fluctuations, the bands widen, creating larger trading ranges. This can help traders identify potential breakout opportunities and manage risk more effectively. However, it is important to note that Bollinger Bands should not be relied upon as the sole indicator for making trading decisions. They should be used in conjunction with other forms of analysis to increase the probability of successful trades.
Yes, Bollinger Bands can be used for short-term trading strategies. Traders can use the bands to identify short-term overbought or oversold conditions and look for potential reversals. Additionally, when the price moves outside the bands, it may indicate a breakout and the start of a new trend. Short-term traders can take advantage of these price movements to enter or exit positions. However, it is important to consider other factors such as volume and market sentiment to confirm the validity of the trading signals provided by Bollinger Bands.
Bollinger Bands can assist with risk management by providing traders with valuable information about market volatility. When the bands are narrow, it suggests that the market is experiencing low volatility, indicating a potential period of consolidation. Traders may choose to reduce their position sizes or avoid trading altogether during such periods to minimize risk. On the other hand, when the bands widen, it indicates increased volatility, which may present opportunities for larger price movements. Traders can adjust their risk management strategies accordingly and set appropriate stop-loss levels based on the width of the bands.
Bollinger Bands are a technical analysis tool that consists of a moving average and two standard deviation lines. They are used to measure the volatility of a financial instrument and to identify overbought or oversold conditions.

Trading in Pakistan: A Step-by-Step Guide Trading in Pakistan has become increasingly popular among individuals looking to generate an additional …
Read Article
Beginner’s Guide: How to Start Trading Forex Forex trading has become increasingly popular in recent years, offering individuals the opportunity to …
Read Article
What is the exercise period for employee stock options? Employee stock options are an important part of many compensation packages, allowing employees …
Read Article
Upgrading Your Options Level on Questrade If you’re an active investor or trader, you may be interested in exploring options trading. Options can …
Read Article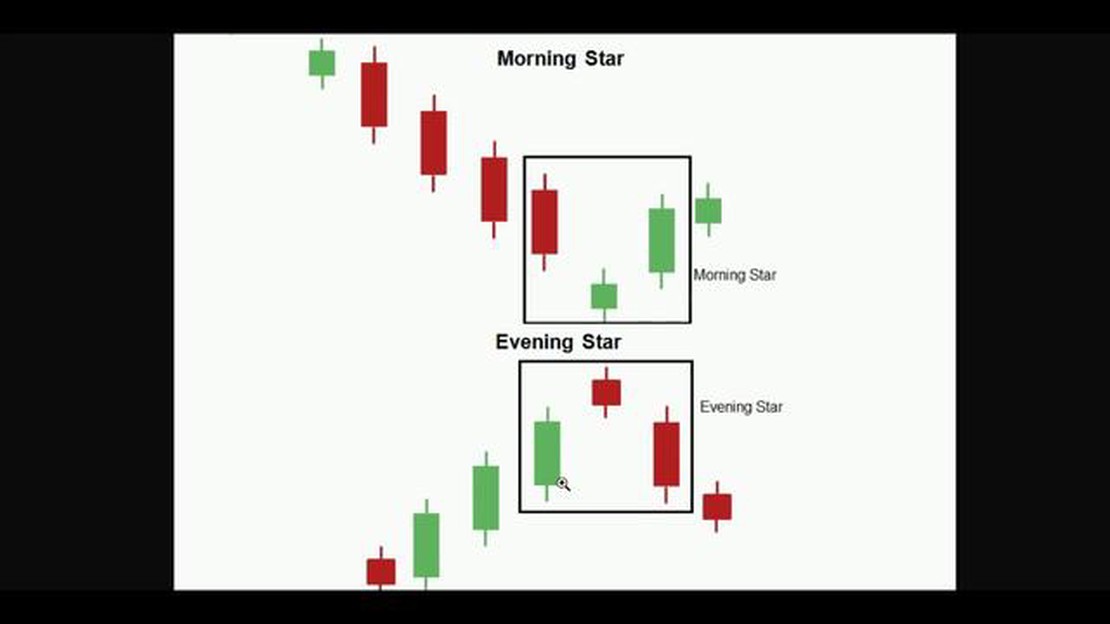
Understanding Morning Star and Evening Star Forex Patterns Forex candlestick patterns are a popular tool used by traders to forecast market movements. …
Read Article
Understanding the 2-Period RSI Backtest The Relative Strength Index (RSI) is a popular technical indicator used by traders to identify potential …
Read Article


