
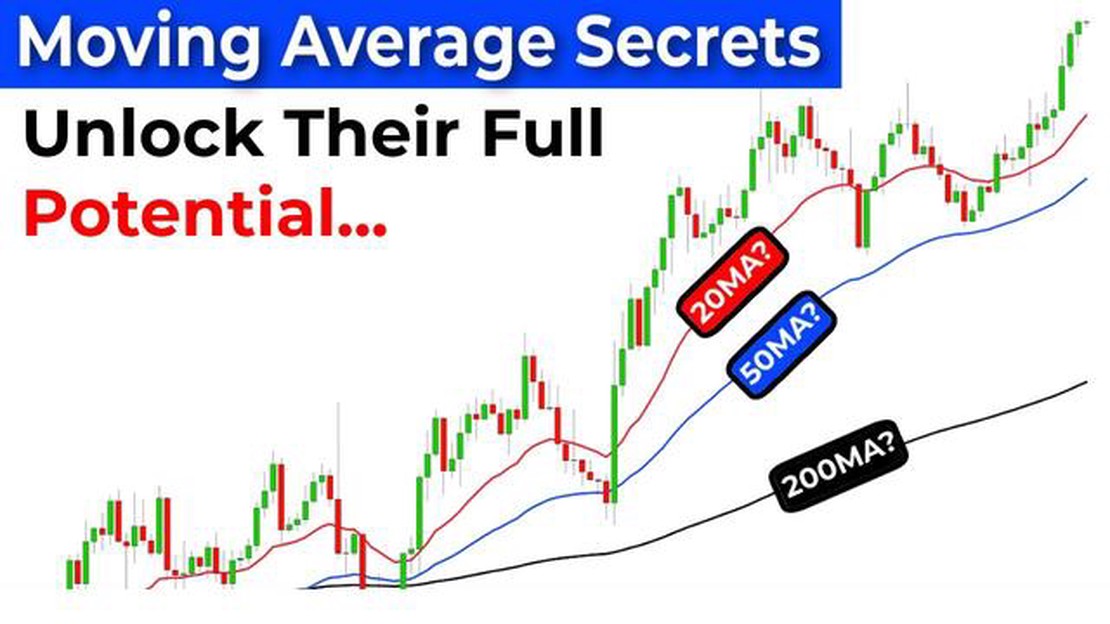

Which EMA combination is best? Discover the winning strategies
Choosing the Best EMA Combination for Optimal Results When it comes to analyzing financial markets, one of the most popular technical indicators used …
Read Article
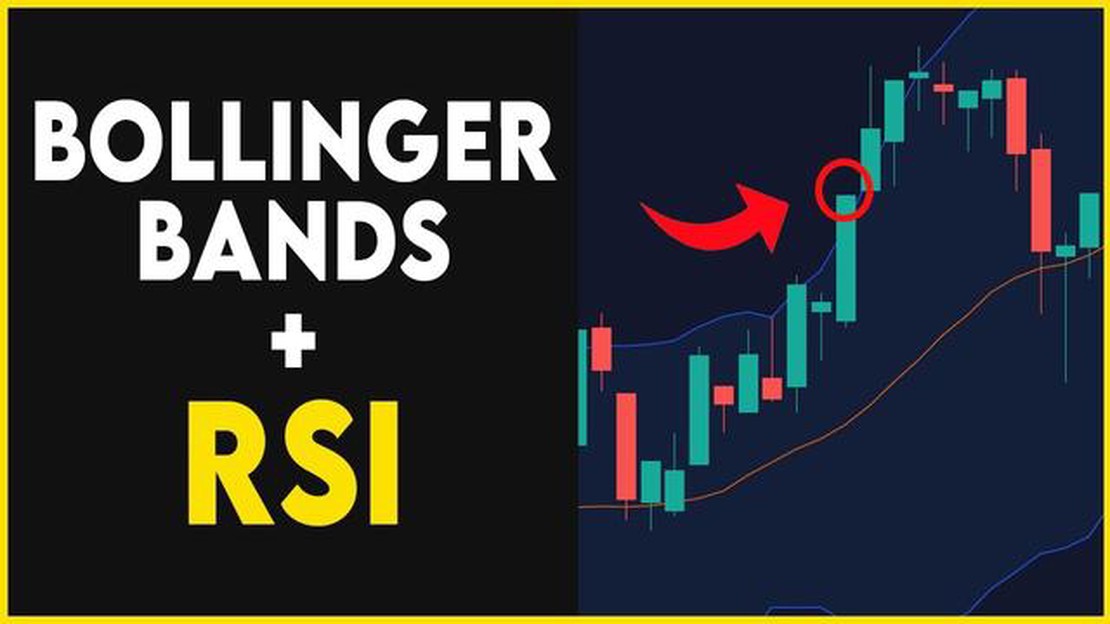
When it comes to technical analysis, the Bollinger Bands trading strategy is one of the most popular and widely used methods. Developed by John Bollinger in the 1980s, this strategy is based on the concept of using volatility to identify potential trading opportunities.
The Bollinger Bands consist of three lines: the upper band, the lower band, and the middle band. The upper and lower bands are calculated by adding or subtracting a multiple of the standard deviation from the middle band. This creates a channel that represents the range of price movements within which the majority of price action is likely to occur.
Traders use the Bollinger Bands to identify periods of high and low volatility. When the price is trading near the upper band, it is considered overbought, and when it is trading near the lower band, it is considered oversold. This information can be used to anticipate potential reversals or breakouts in price.
While the Bollinger Bands trading strategy can be a powerful tool, it is important to understand and apply it correctly. In this step-by-step guide, we will walk you through the process of mastering this strategy, from setting up your charts to executing trades with confidence. Whether you are a novice trader or an experienced pro, this guide will provide you with valuable insights and practical tips to improve your trading skills.
The Bollinger Bands is a popular technical analysis tool used by traders to identify potential price reversals and determine market volatility. It consists of three lines plotted on a price chart, which envelope the price action.
The middle line is a simple moving average (SMA) and represents the average price over a specified period. The upper band is calculated by adding two standard deviations to the SMA, while the lower band is calculated by subtracting two standard deviations from the SMA.
The Bollinger Bands adjust dynamically to changes in market volatility. When the market is more volatile, the bands widen, and when the market is less volatile, the bands narrow. This makes the Bollinger Bands a useful tool for identifying periods of high and low volatility.

Traders use the Bollinger Bands to identify potential buy and sell signals. When the price touches or crosses the upper band, it may indicate that the market is overbought and the price is likely to reverse downward. Conversely, when the price touches or crosses the lower band, it may indicate that the market is oversold and the price is likely to reverse upward. Traders can also look for price breakouts above or below the bands as a potential signal of a strong market trend.
It is important to note that the Bollinger Bands should not be used in isolation but should be combined with other technical indicators and analysis methods to make informed trading decisions. The Bollinger Bands can provide valuable insights into market volatility and potential price reversals, but they are not foolproof and should be used in conjunction with other tools and strategies.
| Advantages | Disadvantages |
|---|---|
| - Provides visual representation of market volatility | - Can give false signals during periods of low volatility |
| - Can help identify potential price reversals | - Should be used in conjunction with other indicators |
| - Can be used in various timeframes and markets | - May lag behind major price reversals |
Bollinger Bands are a popular technical analysis tool developed by John Bollinger in the 1980s. They consist of a simple moving average (SMA) and two standard deviation bands, which are plotted above and below the SMA. The purpose of Bollinger Bands is to provide a visual representation of price volatility and potential overbought or oversold conditions in the market.
The SMA is the center line of the Bollinger Bands and represents the average price over a specified period of time. The standard deviation bands are calculated based on the volatility of price movements around the SMA. The default setting for Bollinger Bands is a 20-period SMA with bands plotted two standard deviations away from the SMA.
Read Also: Understanding the RSI for Options Trading: A Complete Guide
When the price is trending, the distance between the upper and lower bands widens, indicating increased volatility. In contrast, during periods of low volatility, the bands contract, indicating decreased volatility. Traders often use Bollinger Bands to identify periods of consolidation or breakout in the market.
Moreover, Bollinger Bands can provide valuable information about potential overbought or oversold conditions. When the price touches or crosses the upper band, it may suggest that the market is overbought, and a reversal or pullback is likely. Conversely, when the price touches or crosses the lower band, it may indicate that the market is oversold, and a potential reversal or bounce could occur.
Read Also: Best ways to exchange money in Toronto: A comprehensive guide
Bollinger Bands can be applied to various financial instruments, such as stocks, currencies, commodities, and indices. Traders use them to analyze price patterns, spot potential trading opportunities, and determine entry and exit points. Additionally, Bollinger Bands can be used in combination with other technical indicators and chart patterns to enhance decision-making and improve trading strategies.
Bollinger Bands are a technical analysis tool created by John Bollinger in the 1980s. They are used to measure volatility and identify potential overbought or oversold conditions in the market.
The basic concept behind Bollinger Bands is that they consist of a simple moving average (SMA) line in the middle, with an upper band and a lower band that are two standard deviations away from the SMA. The upper band represents the upper limit of the price range, while the lower band represents the lower limit.
When the price is trading within the range defined by the bands, it is considered to be in a normal or consolidated state. However, when the price breaks above the upper band, it is seen as overbought, and when it falls below the lower band, it is seen as oversold.
The widening or narrowing of the Bollinger Bands indicates changes in volatility. When the bands widen, it suggests that market volatility is increasing. Conversely, when the bands narrow, it suggests that volatility is decreasing.

An important thing to note is that Bollinger Bands alone do not provide trading signals. Traders often combine them with other technical indicators or patterns to confirm trade entries or exits. For example, a trader may use Bollinger Bands in conjunction with a momentum indicator or a candlestick pattern to validate a potential trade setup.
Overall, Bollinger Bands are a popular tool among traders due to their ability to provide valuable information about market volatility and potential market reversals. By understanding how they work and incorporating them into your trading strategy, you can make more informed trading decisions and improve your trading results.
The Bollinger Bands trading strategy is a technical analysis tool that helps traders to identify possible price reversals and to determine the overall market trend. It consists of three lines - the upper band, the lower band, and the middle line. When the price touches or crosses the upper band, it is considered overbought, and when it touches or crosses the lower band, it is considered oversold.
To set up Bollinger Bands on your trading platform, you need to find the indicator among the available technical indicators and add it to your chart. Once added, you can customize the indicator according to your preferences, such as adjusting the period and standard deviation. After setting up the Bollinger Bands, the lines will appear on your chart.
There are several common trading strategies using Bollinger Bands, such as the Bollinger Squeeze strategy, the Bollinger Bands breakout strategy, and the Bollinger Bands reversal strategy. The Bollinger Squeeze strategy involves identifying periods of low volatility when the bands are close together, indicating a potential breakout. The breakout strategy involves buying when the price breaks above the upper band or selling when it breaks below the lower band. The reversal strategy involves buying when the price touches or crosses the lower band and selling when it touches or crosses the upper band.
To effectively use Bollinger Bands to manage risk, you can combine them with other technical indicators and tools. For example, you can use the Relative Strength Index (RSI) to confirm overbought or oversold conditions when the price touches or crosses the upper or lower band. Additionally, you can set stop losses and take profits based on the Bollinger Bands, such as placing a stop loss below the lower band for a long trade or above the upper band for a short trade. It is also important to consider the overall market trend and to practice proper risk management techniques.

Choosing the Best EMA Combination for Optimal Results When it comes to analyzing financial markets, one of the most popular technical indicators used …
Read Article
Is Pocket Option Available for Use in the Philippines? Pocket Option is a popular online trading platform that offers a wide range of trading options, …
Read Article
What is an example of a reversal pattern? Reversal patterns are widely utilized by traders to identify potential changes in the trend of a financial …
Read Article
Understanding the Benefits of Hyper Trading Hyper trading is a revolutionary concept in the world of finance and investment. It refers to a highly …
Read Article
Understanding the Rules-Based International Trading Order The global economy is highly interconnected, with countries around the world relying on each …
Read Article
Does Merrill Edge Automatically Exercise Options? As an investor, it is important to understand how your brokerage handles options contracts. One …
Read Article


