


Is Forex Trading Legal in Lebanon? Find Out the Latest Regulations
Is Forex Trading Legal in Lebanon? Forex trading is a popular investment activity around the world. However, each country has its own regulations and …
Read Article

Reversal patterns are widely utilized by traders to identify potential changes in the trend of a financial instrument. These patterns indicate a shift in the market sentiment and can offer insights into future price movements. One example of a reversal pattern is the double top pattern.
The double top pattern is formed when an asset’s price reaches a high point, known as the first peak, then experiences a temporary decline before rallying back up to a similar level, forming the second peak. The two peaks are typically connected by a trough, known as the neckline. This pattern suggests that the uptrend is losing momentum, and a reversal to a downtrend may occur.
Traders who recognize the double top pattern often look for confirmation signals such as a break below the neckline or a decline in trading volume. These signals confirm that a reversal is likely to happen. Once the reversal is confirmed, traders may consider taking short positions or initiating other strategies to capitalize on the expected downtrend.
It is important to note that, like any trading pattern, the double top pattern is not foolproof and should be used in conjunction with other technical analysis tools and indicators. Furthermore, it is crucial to consider the broader market context and other relevant factors before making any trading decisions based on reversal patterns.

In summary, the double top pattern is an example of a reversal pattern commonly observed in trading. This pattern can indicate a potential reversal from an uptrend to a downtrend, and traders often use confirmation signals to validate the pattern. However, it is essential to apply this pattern in conjunction with other analysis techniques and consider the overall market context.
Reversal patterns are one of the key tools used by traders to identify potential trend reversals in financial markets. These patterns can provide valuable insights into market sentiment and can help traders make informed decisions.
Reversal patterns can be classified into different categories, such as chart patterns and candlestick patterns. Chart patterns, such as head and shoulders, double tops, and double bottoms, are formed by the price action on a chart and can indicate a potential reversal in the current trend. Candlestick patterns, such as doji, engulfing patterns, and hammers, are formed by the open, high, low, and close prices of a candlestick and can provide signals of a potential reversal.
One example of a reversal pattern is the head and shoulders pattern. This pattern consists of three peaks, with the middle peak being the highest (the head) and the other two peaks being lower (the shoulders). The head and shoulders pattern suggests that the current trend is about to reverse, with a potential downward move expected. Traders often look for this pattern as a signal to sell and exit their long positions.
Read Also: Discover the Ultimate Confirmation Indicator in Forex Trading
Another example of a reversal pattern is the bullish engulfing pattern. This candlestick pattern occurs when a small bearish candle is followed by a larger bullish candle that engulfs the previous candle. The bullish engulfing pattern suggests a potential reversal from a downtrend to an uptrend. Traders often look for this pattern as a signal to buy and enter a long position.
It is important for traders to understand and recognize reversal patterns, as they can indicate potential trading opportunities. However, it is essential to use other technical analysis tools and indicators to confirm the validity of these patterns before making any trading decisions.
| Reversal Pattern | Description |
|---|---|
| Head and Shoulders | A three-peak pattern, with the middle peak being the highest, indicating a potential trend reversal. |
| Bullish Engulfing | A candlestick pattern where a small bearish candle is followed by a larger bullish candle that engulfs the previous candle, suggesting a potential trend reversal. |
A reversal pattern is a chart pattern that indicates a potential change in the direction of a price trend. It suggests that the previous trend is losing strength and that a new trend may be emerging.
Reversal patterns are commonly used in technical analysis to anticipate market reversals and identify potential entry or exit points for trades. Traders and investors analyze these patterns to gain insight into market sentiment and make informed trading decisions.
There are several types of reversal patterns, each with its own characteristics and implications. Some common examples include:
Read Also: Unveiling the Tactics Employed by Enron: An In-Depth Analysis
These patterns, and many others, can be powerful indicators of potential trend reversals. However, it’s important to note that no pattern is foolproof, and additional analysis and confirmation are always recommended before making trading decisions based solely on reversal patterns.
Reversal patterns in trading are specific price formations on a price chart that indicate a potential change in the current trend. These patterns occur after a prolonged uptrend or downtrend and suggest that the market is ready to reverse its direction.
One example of a reversal pattern is the “head and shoulders” pattern. This pattern consists of three peaks, with the middle one (the “head”) being higher than the other two (the “shoulders”). This pattern suggests a potential reversal from an uptrend to a downtrend.
Traders use reversal patterns as a signal to enter or exit trades. When they spot a reversal pattern forming, they may take it as an opportunity to open a position in the opposite direction of the current trend. They also use these patterns to set stop-loss orders to limit potential losses.

Reversal patterns can be reliable indicators, but they are not guaranteed to be accurate all the time. Traders need to carefully analyze other factors, such as volume and market sentiment, to confirm the validity of a reversal pattern before making any trading decisions.
Some other common reversal patterns include the “double top” and “double bottom” patterns, the “triple top” and “triple bottom” patterns, the “rising wedge” and “falling wedge” patterns, and the “bullish engulfing” and “bearish engulfing” patterns. Each of these patterns has its own characteristics and provides traders with different signals.
Reversal patterns in trading are technical analysis patterns that suggest a possible trend reversal in the price of a security. These patterns are formed by the price movements on a chart and can provide traders with signals to enter or exit a trade.

Is Forex Trading Legal in Lebanon? Forex trading is a popular investment activity around the world. However, each country has its own regulations and …
Read Article
The Future of Option Trading: All You Need to Know Future option trading is a financial instrument that allows traders to speculate on the future …
Read Article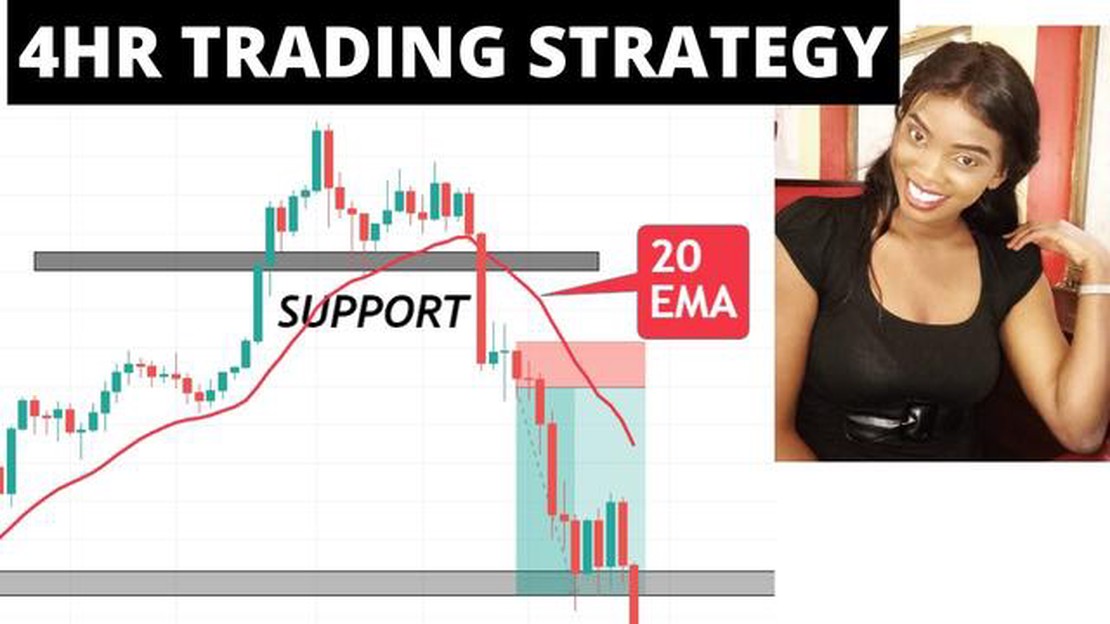
What is the best EMA for 4H? When it comes to trading, one of the key tools that traders use to analyze price movements is the Exponential Moving …
Read Article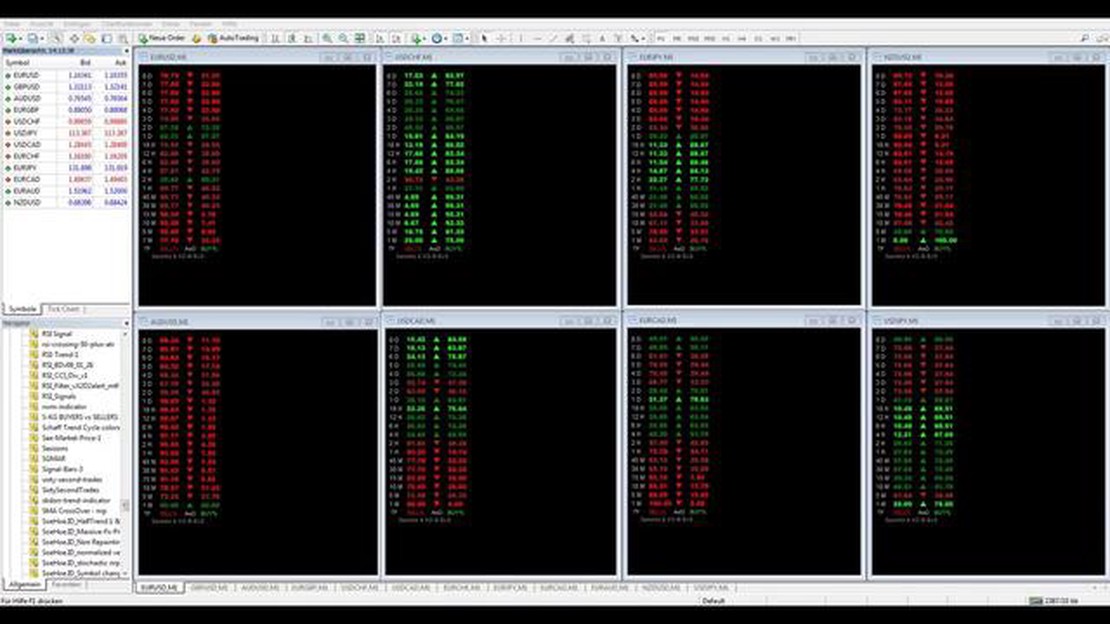
Understanding the Buyer Seller Percentage Indicator in MT4 The Buyer Seller Percentage Indicator is a powerful tool in the MetaTrader 4 (MT4) platform …
Read Article
Understanding Forex Street: What Every Trader Should Know Are you ready to delve into the exciting world of forex trading? Look no further, as we …
Read Article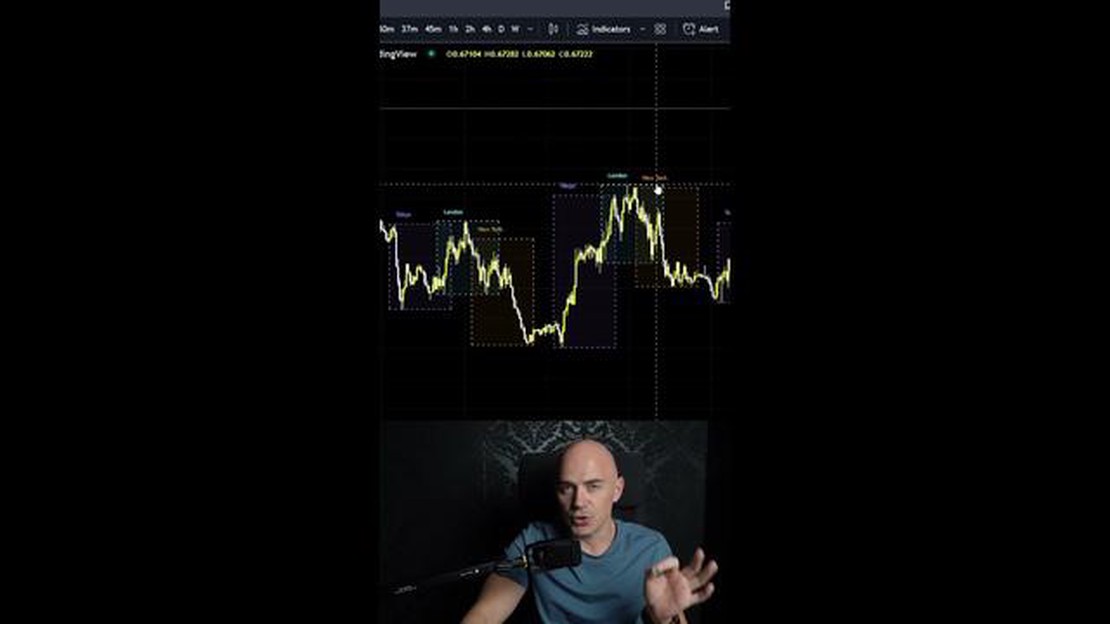
Is Tokyo Forex Market Open Now? The Tokyo Forex Market, also known as the Tokyo Stock Exchange, is one of the largest and most influential financial …
Read Article


