
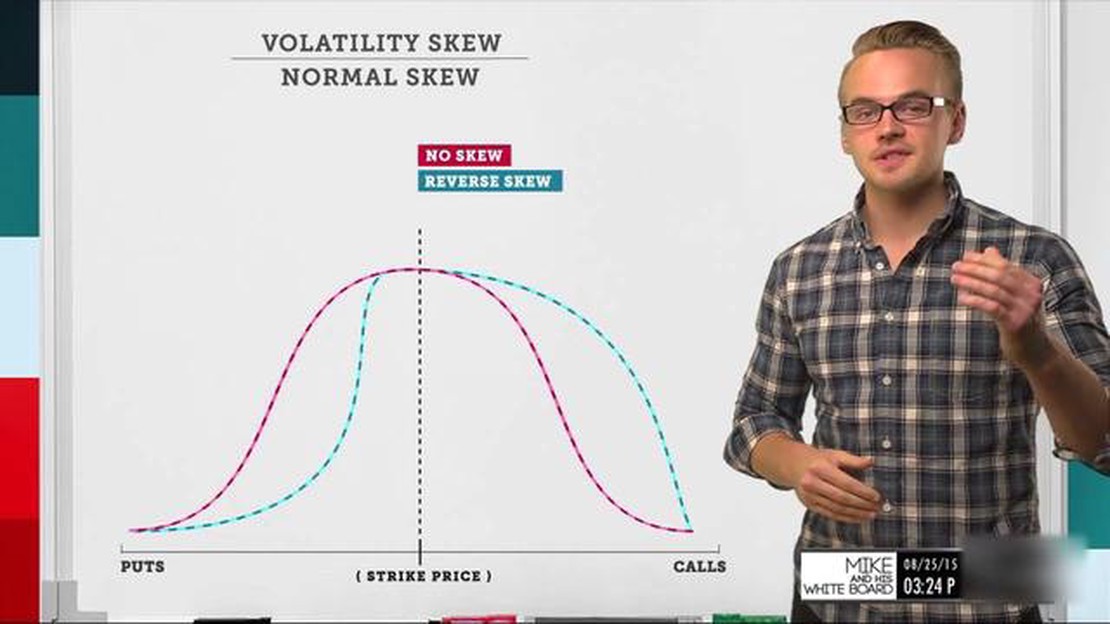

Understanding the Distinction between Skew and Volatility
Understanding the Difference between Skew and Volatility In the world of finance and investing, two key terms that often come up are “skew” and …
Read Article
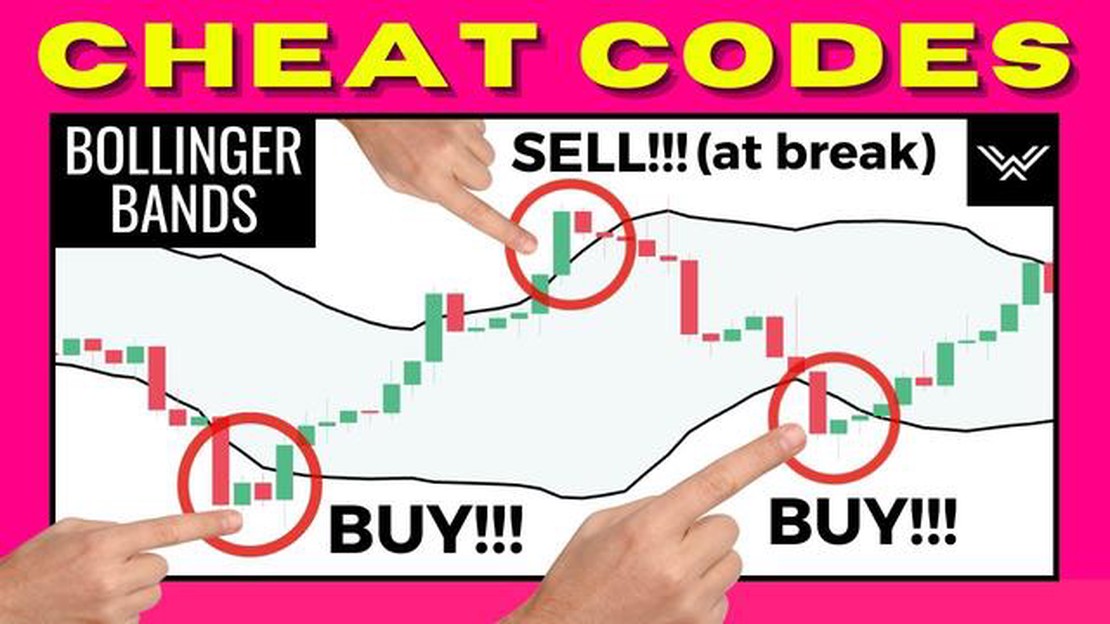
When it comes to day trading, having a good strategy is paramount. One powerful tool that traders often turn to is Bollinger Bands. Developed by John Bollinger, this technical analysis tool has become widely popular among traders for its ability to provide valuable insights into market volatility and potential price movements.
So, what exactly are Bollinger Bands? Bollinger Bands are a set of lines plotted two standard deviations away from a simple moving average. The upper and lower bands represent the potential high and low prices, respectively, of an asset. The distance between the bands widens or narrows based on market volatility.
Traders can use Bollinger Bands to identify potential entry and exit points. When prices are close to the upper band, it may indicate an overbought condition, suggesting a possible reversal or correction. Conversely, when prices are near the lower band, it may suggest an oversold condition, potentially signaling a buying opportunity. Combining Bollinger Bands with other technical indicators can further enhance trading strategies.
This ultimate guide will take you through the ins and outs of mastering Bollinger Bands for day trading strategies. From understanding the theory behind the bands to practical tips on how to effectively use them, you will gain the knowledge and confidence needed to incorporate this powerful tool into your trading arsenal.
“Bollinger Bands are not a standalone strategy, but rather a valuable component of a comprehensive trading approach. Understanding how to interpret them and combining them with other indicators is key to maximizing their effectiveness.”
Whether you are a novice trader looking to expand your knowledge or an experienced trader seeking new insights, this guide will provide you with the essential information to help you master Bollinger Bands and take your day trading strategies to the next level.
Bollinger Bands are a popular technical analysis tool used by traders to assess price volatility and identify potential trend reversals. Developed by John Bollinger in the 1980s, Bollinger Bands consist of a centerline and two price channels that surround it.

The centerline is a moving average, typically the 20-day simple moving average, which helps traders identify the overall trend. The upper and lower price channels are calculated by adding and subtracting the standard deviation of the price from the centerline. The standard deviation is a statistical measure of volatility.
Bollinger Bands are plotted on a price chart, with the price data represented as a line and the upper and lower bands represented as two additional lines. The bands expand and contract based on the volatility of the price. When the price is more volatile, the bands widen, and when the price is less volatile, the bands contract.
Traders use Bollinger Bands to identify potential buy and sell signals. When the price touches or crosses the upper band, it may be a signal that the price is overbought and a potential reversal or correction is imminent. Conversely, when the price touches or crosses the lower band, it may be a signal that the price is oversold and a potential reversal or bounce back is possible.
Read Also: Understanding Dilution: How Stock Options Work
Bollinger Bands can also be used in combination with other technical indicators to confirm or filter trading signals. For example, traders may look for convergence or divergence between Bollinger Bands and other indicators, such as the Relative Strength Index (RSI) or Moving Average Convergence Divergence (MACD), to strengthen their trading decisions.
Overall, Bollinger Bands are a versatile tool that can help traders analyze price volatility, identify potential trend reversals, and make informed trading decisions. By understanding how Bollinger Bands work and integrating them into a comprehensive trading strategy, traders can improve their day trading performance and increase their chances of success.
Bollinger Bands are a popular technical analysis tool used by day traders that can provide valuable insights into price volatility and potential trend reversals. Developed by John Bollinger in the 1980s, Bollinger Bands consist of a simple moving average (SMA) line in the middle, with two outer bands that represent a specified number of standard deviations from the SMA.
The middle band: The SMA line is the center of the Bollinger Bands. It is calculated by adding up a specific number of closing prices and dividing the sum by the number of periods considered. The middle band serves as a baseline or reference point for price movements.
The upper band: The upper band is located above the middle band and is typically set at two standard deviations away from the SMA. It indicates an overbought condition when prices are consistently touching or exceeding the upper band, suggesting that the market may be due for a pullback or reversal.
The lower band: Conversely, the lower band is located below the middle band and is set at two standard deviations away from the SMA. It signifies an oversold condition when prices are consistently touching or falling below the lower band, indicating that the market may be due for a bounce or reversal.
Volatility: Bollinger Bands help traders measure price volatility. When the bands are narrow, it suggests low volatility, indicating a period of consolidation or range-bound trading. Conversely, when the bands widen, it indicates high volatility, suggesting that a significant price move may be imminent.
Bollinger Squeeze: When the bands contract and become extremely narrow, it is known as a Bollinger Squeeze. This occurs when the market has a prolonged period of low volatility, and a big move is expected. Day traders consider a Bollinger Squeeze as a precursor to a potential breakout or significant price move in either direction.
Read Also: Exploring the Different Options for Superannuation Funds
Applications: Day traders use Bollinger Bands in various ways, such as identifying overbought and oversold conditions, anticipating trend reversals, confirming trend strength, and spotting potential breakouts. Traders can combine Bollinger Bands with other technical indicators and chart patterns to enhance their trading strategies.
Remember: While Bollinger Bands are a powerful tool, traders should not rely solely on them for making trading decisions. It’s essential to combine Bollinger Bands with other analysis techniques and employ proper risk management strategies to maximize the effectiveness of trading strategies.
Bollinger Bands are a technical analysis tool that measures volatility and plots two standard deviation bands above and below a moving average.

Bollinger Bands can be used in day trading to identify potential buying and selling opportunities. Traders can look for price action near the bands, such as a bounce off the lower band as a buying opportunity, or a bounce off the upper band as a selling opportunity.
The upper band of Bollinger Bands represents the upper price target, while the lower band represents the lower price target. The price is expected to stay within the bands most of the time, but if it moves above or below the bands, it may indicate a breakout or a reversal.
Bollinger Bands can be used for a wide range of securities, including stocks, futures, currencies, and commodities. However, it’s important to consider the volatility and liquidity of the security before using Bollinger Bands. Securities with low volatility or low liquidity may not provide reliable signals.
Yes, Bollinger Bands can be used in conjunction with other technical indicators to enhance trading signals. Some commonly used indicators in combination with Bollinger Bands are the Relative Strength Index (RSI), the Moving Average Convergence Divergence (MACD), and the Stochastic Oscillator.
Bollinger Bands are a technical analysis tool that consists of a moving average line and two standard deviation lines above and below it. The bands expand and contract based on the volatility of the price of an asset. When the price is near the upper band, it is considered overbought, and when it is near the lower band, it is considered oversold. Traders use Bollinger Bands to identify potential price reversals, confirm trend formations, and generate trading signals.

Understanding the Difference between Skew and Volatility In the world of finance and investing, two key terms that often come up are “skew” and …
Read Article
What is Options Trading? Options trading is a complex yet highly rewarding method of investing that allows traders to speculate on the future price of …
Read Article
Best Places to Exchange Money in Helsinki Planning a trip to Helsinki and wondering where to exchange your currency? Look no further! In this article, …
Read Article
Currency in Ahmedabad: What You Need to Know When planning a trip to Ahmedabad, the largest city in the state of Gujarat, India, it is essential to …
Read Article
What is the value of a micro lot? Forex trading is a popular way for individuals to engage in the global currency market and potentially earn profits. …
Read Article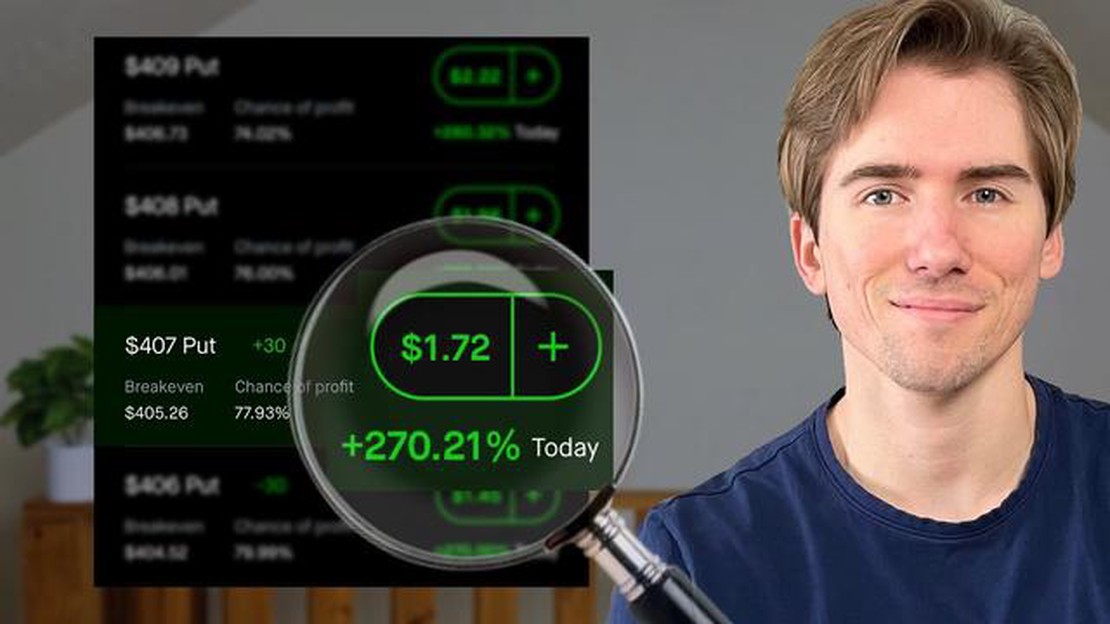
Calculating Strike Price on Options When trading options, one important factor to consider is the strike price of the option. The strike price is the …
Read Article


