

Understanding the Mechanics of Stock Options: A Comprehensive Guide
Understanding how stock options work Stock options are a popular form of financial derivative that provide investors with the opportunity to …
Read Article

When it comes to trading, having the right tools and strategies can make all the difference in maximizing your profits. One such tool that has gained popularity among traders is Kagi charts. These unique charts offer a different perspective on price action and can help traders identify trends and potential entry and exit points.
Kagi charts originated in Japan and were developed to filter out noise and focus on significant price movements. Unlike traditional bar or candlestick charts, Kagi charts display a series of vertical lines that change direction based on predefined price movements. This simplifies the chart and allows traders to easily identify trend reversals and key support and resistance levels.
Understanding how to read Kagi charts is essential for any trader looking to boost their profits. With Kagi charts, traders can quickly identify whether the market is trending up or down, helping them make informed trading decisions. By focusing on the most relevant price movements, traders can filter out noise and avoid getting caught in false breakouts or trend reversals.
Learning how to interpret the various patterns that Kagi charts form is crucial for successful trading. For example, a series of ascending lines indicates a bullish trend, while a series of descending lines suggests a bearish trend. Additionally, Kagi charts can also display reversal patterns, such as a series of alternating thick and thin lines, indicating a potential trend reversal.
By incorporating Kagi charts into your trading strategy, you can gain a deeper understanding of market trends and increase your profitability. Whether you are a beginner or an experienced trader, learning how to effectively use Kagi charts can provide valuable insights into price action and help you make more accurate trading decisions.
In the world of trading, there are many different types of charts that traders use to analyze price movement and make informed decisions. One such chart is the Kagi chart, which is a type of technical analysis tool that focuses on the visual representation of price movements.
The Kagi chart originated in Japan and was used to analyze the movement of rice prices. It is known for its simplicity and ability to filter out noise and provide traders with a clear picture of price trends.
Unlike other types of charts, such as line charts or candlestick charts, Kagi charts do not use a specific time frame. Instead, they focus on price action and only change direction when the price exceeds a certain threshold. This allows traders to identify significant price movements and trends without being influenced by short-term fluctuations.
One of the key features of Kagi charts is the use of horizontal lines, or “Kagi lines,” to represent price movement. These lines are either solid or dashed and change direction based on predefined rules. When the price exceeds a certain threshold, a new line is added, and the direction changes accordingly.
Traders use Kagi charts to identify trends and reversals in price movement. The direction of the Kagi lines and their thickness can provide valuable insights into the strength of a trend. For example, thick, solid lines indicate a strong uptrend, while thin or dashed lines suggest a weaker trend or a potential reversal.
Another useful aspect of Kagi charts is the ability to use different reversal criteria. Traders can adjust the threshold at which a new line is added, allowing them to capture different types of price movements. This flexibility makes Kagi charts suitable for various trading styles and strategies.
In conclusion, understanding Kagi charts is essential for traders looking to analyze price movement and make informed decisions. It is a powerful tool that provides a clear visual representation of trends and reversals, allowing traders to optimize their trading strategies and boost their profits.
Kagi charts are a type of technical charting tool commonly used in financial markets to analyze and forecast price trends. They were developed in Japan in the 1870s by a newspaper journalist named Homma Munehisa, who applied the charting techniques to track price movements of rice futures.

Kagi charts are unique in that they focus solely on price and do not take into consideration time or volume. Instead, they use a series of straight lines that change direction based on predefined price movements. This makes Kagi charts beneficial for traders who want a clear visual representation of trend reversals and significant price movements.
Read Also: What is the daily turnover of the forex market worldwide? Discover the staggering figures here
The construction of a Kagi chart involves two types of lines: a rising line and a falling line. A rising line is drawn when the price exceeds the previous high point, while a falling line is drawn when the price falls below the previous low point. The lines are connected, forming a visual representation of the price trend.
Traders can also set their own parameters for constructing Kagi charts, such as the minimum price movement required to change direction. This flexibility allows traders to adjust the charts based on their preferences and trading strategies.
When analyzing Kagi charts, traders look for patterns and trend reversals. Different patterns, such as shoulder-tops and shoulder-bottoms, can indicate potential trend changes or continuation. Traders also pay attention to the overall direction of the Kagi lines to determine the prevailing trend.
Kagi charts can be used in conjunction with other technical analysis tools, such as moving averages and oscillators, to confirm signals and make more informed trading decisions. They provide a unique perspective on price trends and can help traders identify buying and selling opportunities.
Kagi charts are an effective tool for visualizing price trends and making trading decisions. Here’s how you can incorporate Kagi charts into your trading strategy:
1. Understand the Basics:
Before using Kagi charts, it’s important to understand their basic construction. Kagi charts consist of a series of vertical lines, either solid or dashed, depending on the price movement. A solid line indicates an upward price movement, while a dashed line indicates a downward movement. The chart formation is determined by changes in the price that exceed a predefined value, known as the reversal amount.
2. Identify Trend Reversals:
Read Also: What were the turtle trading rules? Discover the rules used by the legendary turtle traders
One of the key benefits of Kagi charts is their ability to help identify trend reversals. When the price surpasses the previous high or low by the reversal amount, the chart changes direction. This can provide traders with early signals to enter or exit a trade. By closely monitoring the chart patterns and trend reversals, you can improve your timing and increase the profitability of your trades.

3. Analyze Chart Patterns:
In addition to trend reversals, Kagi charts can also reveal important chart patterns, such as support and resistance levels, double tops or bottoms, and trend channels. These patterns can provide valuable insights into potential price movements and possible trading opportunities. Analyzing these patterns in conjunction with other technical indicators can further enhance the accuracy of your trading strategy.
4. Combine with Other Technical Analysis Tools:
While Kagi charts are powerful on their own, they can be even more effective when combined with other technical analysis tools. You can use indicators such as moving averages, oscillators, and volume analysis to validate the signals provided by Kagi charts. This multi-dimensional analysis can reduce the risk of false signals and increase the overall profitability of your trades.
5. Practice and Refine:
As with any trading strategy, practice is key to success. Take the time to familiarize yourself with Kagi charts and experiment with different settings and indicators. Keep a record of your trades and analyze the results to identify any areas for improvement. By continuously refining your strategy and adapting it to changing market conditions, you can maximize your profits and minimize your losses.
In conclusion, incorporating Kagi charts into your trading strategy can provide you with valuable insights into price trends, trend reversals, and trading opportunities. By understanding their construction, analyzing chart patterns, and combining them with other technical analysis tools, you can boost your profits and achieve greater success in trading.
Kagi charts are a type of chart used in technical analysis to track price movements of an asset. They are built using a series of vertical lines that change direction based on predefined price movements. When the price exceeds a certain predefined value, the Kagi chart will change direction, creating a new line. This helps traders identify trends and reversals in the market.
Yes, Kagi charts can be used for any type of asset that has price data. Whether you are trading stocks, forex, commodities, or cryptocurrencies, Kagi charts can help you identify trends and make trading decisions.
Kagi charts have several advantages over other types of charts. They provide a clear visual representation of price trends and reversals, making it easier for traders to identify trading opportunities. Kagi charts also filter out small price movements and focus on significant price changes, reducing noise and providing a clearer picture of market trends. Additionally, Kagi charts can be used in conjunction with other technical indicators to confirm trading signals.
Yes, Kagi charts can be used by novice traders. They provide a simple and straightforward way to analyze price movements and identify trends. However, it is important for novice traders to learn how to interpret Kagi chart patterns and use them in conjunction with other technical analysis tools. They should also practice using Kagi charts on demo accounts before using them in real trading.

Understanding how stock options work Stock options are a popular form of financial derivative that provide investors with the opportunity to …
Read Article
Easy Steps to Understand Forex Trading Forex trading, also known as foreign exchange trading, is the largest and most liquid financial market in the …
Read Article
Understanding Unit Trade Size: What You Need to Know When it comes to forex trading, understanding unit trade size is crucial for success. The unit …
Read Article
What Makes TMX Stand Out: A Closer Look at TMX Features and Benefits TMX is a globally recognized leader in providing top-notch expertise and services …
Read Article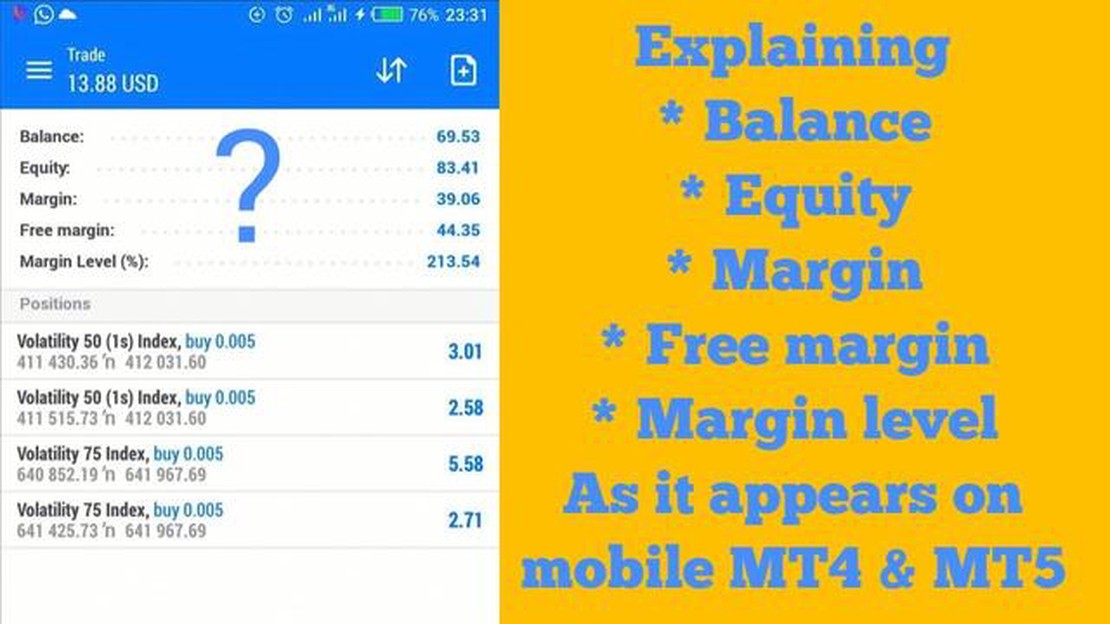
Calculating Free Margin and Margin: A Step-by-Step Guide Trading in financial markets can be a lucrative venture, but it is also important to …
Read Article
What is 20 sma Bollinger Bands? When it comes to analyzing financial markets, there are countless technical indicators that traders rely on. One such …
Read Article


