


Are ETPs a good investment? Key factors to consider
Are ETPs a good investment? Exchange-Traded Products (ETPs) have gained popularity among investors in recent years due to their ease of trading and …
Read Article
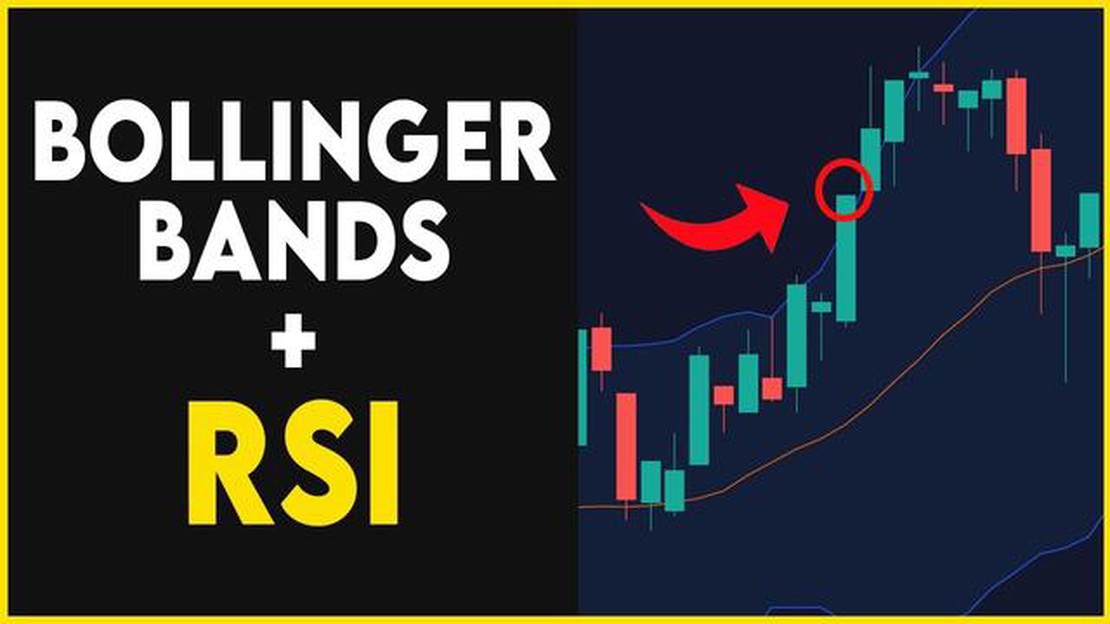
When it comes to analyzing financial markets, there are countless technical indicators that traders rely on. One such indicator is the 20 Simple Moving Average (SMA) Bollinger Bands. This powerful tool, often used in conjunction with other indicators, can provide valuable insights into market trends and potential price movements.
The 20 SMA Bollinger Bands consist of three lines: the middle line, which is the 20 SMA; the upper band, which is the standard deviation of the price multiplied by 2 and added to the SMA; and the lower band, which is the standard deviation of the price multiplied by 2 and subtracted from the SMA. The middle line represents the average price over a specific period, while the upper and lower bands represent the volatility of the price.
By visually representing price volatility, the 20 SMA Bollinger Bands can help traders identify potential buying or selling opportunities. When the price touches or falls below the lower band, it may indicate an oversold condition and a potential buying opportunity. Conversely, when the price touches or rises above the upper band, it may indicate an overbought condition and a potential selling opportunity.
However, it is important to note that the 20 SMA Bollinger Bands should not be used in isolation. Traders should always consider other technical indicators, such as momentum oscillators or volume indicators, to confirm their analysis. Additionally, it is crucial to consider other market factors, such as news events or economic data, that may impact the price movement.
Remember, technical analysis is just one tool in a trader’s arsenal. It should be used in conjunction with fundamental analysis and risk management techniques to make informed trading decisions.
Overall, the 20 SMA Bollinger Bands can be a valuable tool for traders looking to analyze market trends and potential price movements. By understanding how this indicator works and incorporating it into a comprehensive trading strategy, traders can improve their chances of making profitable trades in the financial markets.
The SMA is a commonly used trend-following indicator that calculates the average price over a specified period of time. It helps smooth out price fluctuations and provides a clear picture of the overall trend. The SMA is calculated by summing up a specific number of closing prices and dividing it by the number of periods.
The Bollinger Bands, on the other hand, are volatility bands that are plotted above and below the SMA. The bands are based on standard deviation, which measures how spread out the prices are from the average. The standard deviation is multiplied by a factor (usually 2) and added or subtracted from the SMA to create the upper and lower bands.
The SMA Bollinger Bands provide traders with three lines: the upper band, the SMA, and the lower band. These lines help traders identify potential support and resistance levels, as well as overbought and oversold conditions. When the price moves towards the upper band, it indicates that the market is overbought, while a move towards the lower band suggests that the market is oversold.
Traders can also use the SMA Bollinger Bands to identify trend reversals. When the price crosses above or below the upper or lower band, it may signal a potential trend reversal. However, it is important to confirm these signals with other technical indicators or price patterns.
In summary, SMA Bollinger Bands are a powerful tool that combines the simple moving average and the Bollinger Bands to analyze price volatility and identify potential market reversals. It provides traders with valuable insights into market conditions and helps them make more informed trading decisions.
Read Also: Unveiling the record-breaking pound to peso exchange rate in history
The SMA Bollinger Bands are a technical analysis tool used in trading to identify periods of price consolidation and potential breakouts. They are created using the combination of a simple moving average (SMA) and Bollinger Bands.
The simple moving average is calculated by summing up the closing prices of a specific number of periods and dividing the sum by the number of periods. This moving average helps smooth out the price data and provides a clearer representation of the overall trend.
Read Also: Best Places to Exchange Currency for Euros
The Bollinger Bands, on the other hand, consist of an upper band, a lower band, and a middle band, which is the SMA. The upper and lower bands are calculated based on a given number of standard deviations away from the middle band. The standard deviation measures the volatility of the price, and by using multiple standard deviations, the Bollinger Bands expand and contract based on the level of volatility.
The concept behind the SMA Bollinger Bands is that price tends to stay within the upper and lower bands during periods of consolidation, indicating a lack of significant price movement. This is often referred to as the “squeeze” because the bands appear to squeeze the price. Traders can use this information to identify potential breakout opportunities when the price moves outside of the bands.
When the price breaks above the upper band, it may indicate a bullish breakout, while a break below the lower band may indicate a bearish breakout. These breakouts are seen as potential trading opportunities because they suggest a significant shift in market sentiment and potential price momentum.
Traders can also use the width between the upper and lower bands as a measure of volatility. A wider band indicates higher volatility, while a narrower band suggests lower volatility. This can be useful in determining the strength of a breakout and setting appropriate stop-loss and take-profit levels.
In conclusion, the SMA Bollinger Bands provide traders with a visual representation of price consolidation and potential breakouts. By understanding the concept behind these bands and using them in conjunction with other technical indicators, traders can improve their trading decisions and increase their chances of success in the market.
Bollinger Bands are a technical analysis tool that consists of a simple moving average (SMA) and two standard deviations plotted above and below the SMA.

Bollinger Bands can be used to identify price volatility and potential trend reversals. Traders often use them to generate buy and sell signals.
When the price touches or exceeds the upper Bollinger Band, it suggests that the market is overbought and there may be a potential opportunity to sell or short the asset.
When the price touches or falls below the lower Bollinger Band, it suggests that the market is oversold and there may be a potential opportunity to buy or go long on the asset.
The 20 SMA can be used as an additional indicator to confirm trends or identify potential support and resistance levels when combined with Bollinger Bands.

Are ETPs a good investment? Exchange-Traded Products (ETPs) have gained popularity among investors in recent years due to their ease of trading and …
Read Article
How to Become a Sniper Trader Becoming a successful sniper trader requires more than just an understanding of the stock market - it requires a unique …
Read Article
Where can I find a valid promo code? In today’s fast-paced world, everyone loves a good deal. Whether you’re shopping online or in-store, finding a …
Read Article
Transferring Money from BPI Dollar to Peso: Step-by-Step Guide Transferring money from one currency to another can be a daunting task, especially when …
Read Article
Does Sam Evans become a model? Sam Evans, a talented and charismatic individual, has been making waves in the entertainment industry for several …
Read Article
Which indicator is most accurate for intraday trading? Intraday trading is a fast-paced and dynamic form of trading that involves buying and selling …
Read Article


